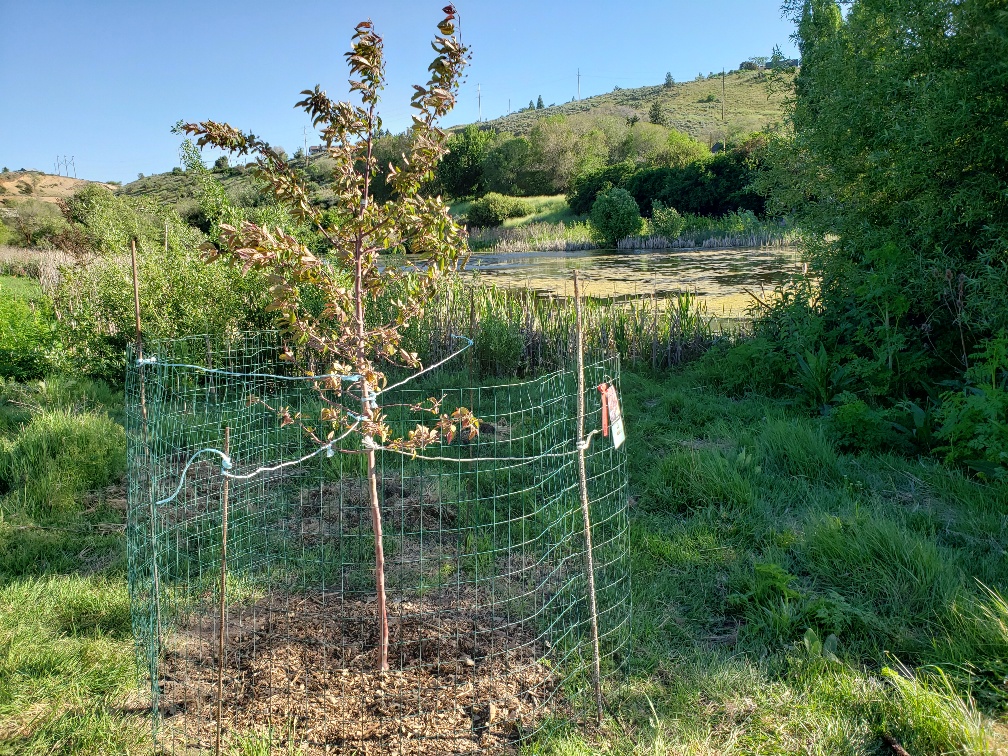
On Tuesday August 18, 2020, at 11 AM, the LWV Klamath Falls participated in one final commemoration ceremony to honor the 100th anniversary of the LWV and the passage of the 19th amendment, gaining women the right to vote. Two trees recently planted were joined by a new bench with a plaque on it. The tree and bench are located on the Klamath Wingwatchers trail, located near the Visitor Center at 205 Riverside Drive on the west side of Highway 97.
Tree planting
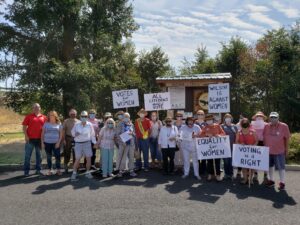
Dedicated LWV Klamath members and friends
Herald and News Story
It took the prompting of a mother to her son to help ratify the 19th Amendment on Aug. 18, 1920, clearing the way for voting rights for many women whose efforts to attain it had spanned decades.
That day, State Rep. Harry T. Burn’s vote garnered the two-thirds majority needed to make the 19th Amendment official. Many, mostly white women could officially vote eight days later.
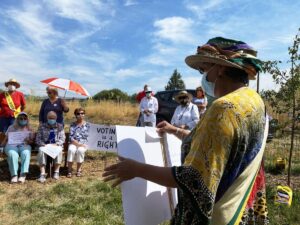
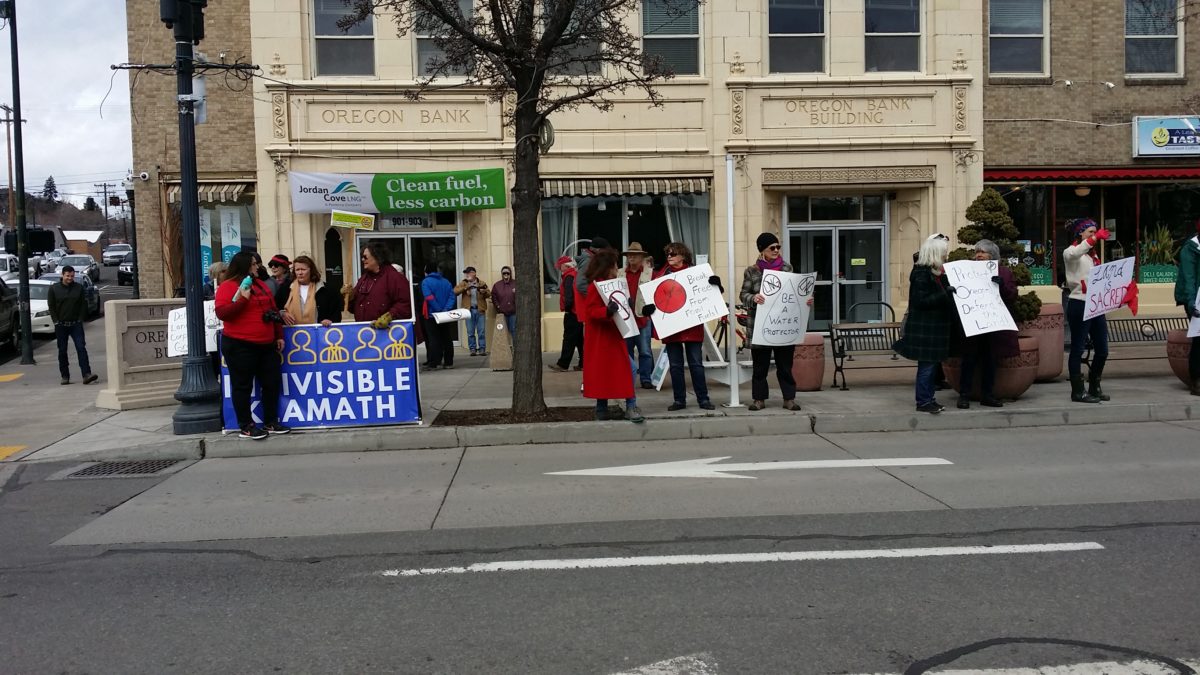
To celebrate the 100th Anniversary of the ratification, League of Women Voters of Klamath County charted their own path down the Ken Hay Nature Trail on Tuesday, where they celebrated 100 years of voting rights, commemorated the efforts that led to the ratification, and shared about the struggles that remain in the pursuit of voting.
The event is the third piece of what has been a year-long effort to mark 100 years of women earning the right to vote. Other pieces included a dramatic play and the book “Timeless Recipes: The Great Fight to win the Vote for Klamath County.”
Klamath Falls Mayor Carol Westfall, dressed in Suffrage purple and gold, marveled at the actions of Burns and his fellow legislators, and all the women who helped pave the way to the vote.
“It really changed the course of this nation,” she said.
Westfall was one of about 20 attendees, including founding members of the League of Women Voters of Klamath County, to join the walk along the portion of the Klamath Wingwatcher’s Lake Ewauna Nature Trail. Many dressed in hats, and/or carried signage that reflected the time period of Suffrage Movement and that still resonates today: “Votes for Women,” “Equality for Women,” and “Voting is a right.”
Leslie Lowe, longtime treasurer and member of League Women Voters of Klamath County, emphasized the long history of securing a woman’s right to vote dates back further than the centennial anniversary.
“It’s really important to remember that that the fight to get the right to vote and actually be able to cast that vote has gone on since before the Declaration of Independence,” Lowe said. “It’s not just history, it’s alive today.”
Women in Klamath County had been able to vote since Nov. 5, 1912, when Klamath County men voted in favor 919-688.
Joan Balin Staunton, one of two surviving founding League of Women Voters founding members present, also helped start the Klamath County chapter in 1976 after moving to Klamath Falls from Federal Way, Washington.
Anita Ward, also a founding member, attended the event as well.
Staunton said both saw the chapter actively help institute Kindergarten in Klamath County before it became a statewide requirement.n She recalled efforts to get people registered to vote at grocery stores in town.
Staunton encourages women to take leadership roles and participate in the community.
“It’s so important for women to be active,” Staunton said.
Heather Tramp, executive director of Klamath County Chamber of Commerce, said that from an early age, her great-grandmother instilled in her the importance of voting.
Tramp said her great-grandmother grew up during a time when women could not vote and the impact of that has not been lost on her.
“I’m thankful for the women and the men that stepped up and got us that right,” Tramp said. “That led me to a lifelong passion for being involved at our local, our state level, and our federal level.
Gutierrez, who also spoke at an event celebrating the centennial on Feb. 9, emphasized that “women earned the right to vote.”
Gutierrez called the period that lead up to the ratification one of the “darkest” periods of history, in part due to hunger strikes and oppression toward women who took part in the Suffrage Movement.
“Women went to jail for this cause,” Gutierrez said.
“Timeless Recipes: The Great Fight to win the Vote for Klamath County,” the 100th Anniversary cookbook and history lesson elaborates, describing the experiences of women who fought for voting rights:
“They picketed for the right to vote, were put in jail, and some declared insane. Jail guards grabbed, dragged, beat, choked, slammed, pinched, twisted, and kicked the women, with no consequences to the guards.”
Lowe emphasized than in 1920 and beyond, despite having the technical right to vote, women of color still had many barriers between them and the polls.
“Although they had the right to vote, they didn’t have the opportunity to vote because of poll taxes and a whole variety of ways that they were kept from the polls,” said Leslie Lowe, treasurer of the League of Women Voters of Klamath County, “Until the Civil Rights Act of 1965, and here we are today, 55 years later, and we’re still dealing with the same oppression.”
Emily Strauss, president of the League of Women Voters of Klamath County, spoke of additional barriers to voters on behalf of Diane Shockey, who served the past year as chair of a committee to organize the centennial celebrations. Shockey is dealing with COVID-19 and is expected to recover, according to Strauss.
Wingwatchers Trail Info
Klamath Wingwatchers has developed a 2.5 mile trail along the western shore of Lake Ewauna and on both sides of Highway 97 as it enters into downtown Klamath Falls. Along this trail, Wingwatchers planted over 1500 trees, shrubs, and other plants that provide shelter and food for the many species of wildlife that utilize the area. Picnic tables and benches, information kiosks, and signage enhance the walking experience. Pets are welcome so long as they are leashed and owners use poop bags, which are provided at the start of each trail. Licensed bicycles are permitted so long as the rider is respectful of pedestrians. Brochures at the head of each trail tell about native plants and the trail. Here is our interpretive guide.Here is our native plants brochure.
Good news! Here’s a press release from Crag Law Center that explains what happened and some of what this means. I want to add a little more context by way of giving kudos to the legal team that accomplished this.
The Crag Law Center and the LWV go way back. The LWVUS and LWVOR have filed two amicus briefs in support of plaintiffs in Juliana v. USA, the landmark climate lawsuit initiated in 2015 and is still ongoing. Crag’s Executive Director Courtney Johnson drafted both of those briefs for the Leagues. That in addition to work against JCEP.
Tonia Moro, who represented the Coos Bay Citizens for Renewables in the LUBA reversal, has been in the JCEP fight over the long haul, too. She was supported in this current work in part by a grant from the LWVOR, precisely because of her track record for getting things done and the understanding that receipt of local land use permits, including this one, are an essential part of the bigger effort to stop this project.
There’s way more to this very complex story, but we want to underscore Tonia’s and Courtney and her colleagues at Crag’s excellent work on behalf of the local, state, national, and global community, including to stop this massive project. If built, it would deal an enormous blow to Oregon’s goals and efforts to reduce GHG emissions and ensure environmental justice and cause irreparable damage to the natural and human environment across southern Oregon and in the Coos Bay Estuary and community.
As the State of Oregon is battling JCEP’s attempt to get FERC to declare that Oregon waived its Section 401 authority, making moot DEQ’s May 2019 denial of that essential permit, the EPA released its new rules on that section of the Clean Water Act yesterday. In other words, the Administration is lending a hand to get JCEP done in case FERC doesn’t do this additional job.
A congratulatory article in the Financial Times this morning said this: “The Trump administration has curbed US states’ power to veto energy infrastructure projects, drawing praise from fossil fuel industries for a move that could make it easier to build pipelines and export terminals across the country. The Environmental Protection Agency on Monday reinterpreted provisions in the federal Clean Water Act that state governors had used to stymie projects targeted by climate campaigners. . . . The state of Oregon blocked the Jordan Cove liquefied natural gas export terminal citing the provision. . . . Energy companies argued the states were abusing a clause in the water law to obstruct projects they opposed for other reasons. Andrew Wheeler, EPA administrator, said the agency was returning the certification process to its ‘original purpose, which is to review potential impacts that discharges from federally permitted projects may have on water resources, not to indefinitely delay or block critically important infrastructure.’”
It’s not clear yet whether Pembina will attempt to use the new regs to try to get JCEP to happen. It seems that JCEP might submit a new application for their 401 permit now under the new rules as a Plan B, but they also might wait and let their waiver claim to FERC play out first. If FERC grants their petition, Oregon (and community opponents of JCEP) may sue. If they reapply, the regular state permitting process will need to proceed. It’s unlikely DEQ will grant the permit because of the egregious adverse impacts, even under the new rules. And Governor Brown (and the LWVOR) commented in opposition to the proposed regs last fall (both attached), charging that they were unlawful misinterpretations of the Clean Water Act, as did any other states and environmental organizations. That route likely leads to court, as well.
dateline: May 27, 2020
NATURAL GAS: Ore. landowners sue over ‘indefensible’ export project
A group of about 30 property owners has sued to block a proposed Oregon liquefied natural gas export terminal and corresponding pipeline that would cut across their land.
The landowners asked the U.S. Court of Appeals for the District of Columbia Circuit on Friday to review the Federal Energy Regulatory Commission’s approval of the Jordan Cove LNG export project and the Pacific Connector Gas pipeline.
“We will do all we can to try and stop this incredible overreach and the blatant misuse of eminent domain to benefit special interests over public interest,” said Deb Evans, a challenger in the case.
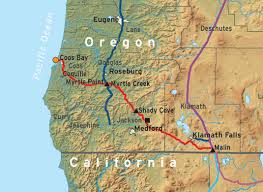
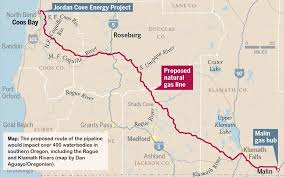
The $10 billion project, backed by the Canada-based Pembina Pipeline Corp., would include a 230-mile, 36-inch-diameter feeder pipeline that would run from a town along the Oregon-California border to a 200-acre natural gas liquefaction and export terminal at Coos Bay. The export hub would be the first on the West Coast, closer to energy-hungry Asian markets.
The oil and gas industry has been pushing for the development of LNG terminals to facilitate greater exports of gas as the fuel glut continues. The terminals liquefy gas by refrigerating it to minus 260 degrees Fahrenheit, which reduces its volume and allows it to be transported on ships. The Jordan Cove hub could liquefy up to 1.04 billion cubic feet of natural gas per day for export to Asia.
FERC approved the project in March and last week upheld its decision despite requests to reconsider from affected landowners, the state of Oregon, tribes, environmentalists and fishing interests (Greenwire, May 21).
David Bookbinder, chief counsel of the Niskanen Center, who is representing the landowners, said he’s confident the D.C. Circuit will rule in their favor.
The Jordan Cove project, he argues, does not pass the eminent domain test. While FERC can issue a certificate of public convenience and necessity, which grants eminent domain authority to developers, the project must demonstrably serve public interests.
Bookbinder said the D.C. Circuit made clear last year in City of Oberlin, Ohio, v. FERC that an export-only project doesn’t automatically meet this threshold. In that case, the court instructed FERC to take a second look at its rationale for approving the Nexus pipeline, which runs through Ohio and Michigan on its way to Canada (Energywire, Sept. 9, 2019).
“The law is you can’t count this,” he said.
Bookbinder will argue on behalf of landowners affected by the Jordan Cove project that a Canadian company selling Canadian gas likewise does not benefit the American public.
He also noted an absence of gas contracts for the project. In 2016, under the Obama administration, FERC rejected Jordan Cove because of concerns about consumer demand. Bookbinder said the project’s developers have not assuaged those fears.
“The idea that a company that has no customers will take U.S. property in order to ship Canadian gas to Japan is outrageous,” Bookbinder said. “That is indefensible in so many different ways.”
‘Landowners get thrown under the bus’
For the property owners involved, the court filing offers a glimmer of hope in what has been a 15-year saga.
The Jordan Cove project was proposed as a natural gas import facility in the early 2000s, when Evans and her husband, Ron Schaaf, bought their property. The project was changed to an export site when U.S. hydraulic fracturing operations significantly boosted domestic supplies.
“We were busy; our kids were in school. We followed it, but not super-close,” Evans said. “Then fracking came in, and the project disintegrated.”
In 2013, Jordan Cove’s developers filed a new application with FERC. Their bid was denied in 2016 following concerns about a lack of customers; falling property values; and harm to environmental resources that support timber, fishing and other local industries (Energywire, March 14, 2016).
“It’s the same landowners who have been affected by this for 15 years,” Schaaf said. “Landowners get thrown under the bus, and many landowners don’t have a lot of money. Not everyone has the opportunity to advocate for themselves.”
FERC Chairman Neil Chatterjee, a Republican, stressed that while Pembina has eminent domain authority to condemn private property for its pipeline, no construction on the pipeline or LNG terminal, including land clearing, can take place until the company has obtained the necessary permits — which is proving to be an uphill battle.
Oregon’s Department of Environmental Quality denied the project’s water quality certification. The state Department of Land Conservation and Development rejected a permit because of the adverse effects the facility would have on coastal and critical habitats, as well as on endangered species. In February, it ruled that the project was not in line with the state’s coastal zone land use laws.
Pembina recently withdrew its application for a dredging permit when the Department of State Lands indicated that it was about to reject that application, as well.
Evans said she doesn’t understand why FERC would allow the pipeline developer to condemn her land while at the same time agreeing that no construction can begin without the requisite permits.
“Why would eminent domain be allowed before the conditions are met?” she asked.
‘FERC is delivering on its promise’
On a call with reporters after rejecting requests for rehearing on the project, Chatterjee said eminent domain is outside FERC’s jurisdiction.
“When it comes to eminent domain, we have no authority,” he said. “We’ve got expertise in how essential it is to siting pipelines.”
For landowners, Friday’s D.C. Circuit petition carries extra meaning. FERC’s swift rejection of the request for rehearing allowed landowners to seek recourse instead of hanging in legal limbo while pipeline construction moved forward.
“It’s a good example of Neil Chatterjee following up and delivering on his promises,” Bookbinder said. “FERC is delivering on its promise that it would not stop landowners from going to court.”
The commission has recently come under fire for issuing so-called tolling orders, which indefinitely extend the deadline for FERC to respond to landowner challenges while allowing pipeline construction to proceed.
FERC has issued a tolling order for every rehearing request filed over the past 12 years. Every case was then eventually denied. On average, 212 days — about seven months — passed between the time a landowner made a request for rehearing and when FERC ultimately denied it.
While Chatterjee has said his agency has addressed the issue, a case against FERC’s use of tolling orders is pending before the D.C. Circuit (Energywire, April 28).
Schaaf said he’s grateful that the landowners’ complaint over Jordan Cove can move forward.
“We understand owning property is a privilege and fighting for it is a privilege,” he said. “We’ll be in this until the end. We don’t know how it’s going to turn out.”
1) Recall from last update that the State of Oregon (specifically four agencies) had filed a petition for Rehearing on FERC’s Order granting the two major federal authorizations JCEP needs to go forward. The article also mentioned that a coalition of around 30 organizations also filed a petition for Rehearing, but was not very specific. That petition included Niskanen Center, the law firm representing around 20 affected landowners, Sierra Club, and also for the interest of this group, the four local LWV that have been jointly opposing JCEP since their application. Yesterday, the FERC met and denied those petitions. I haven’t read the Order yet, but it includes some confusing language that we’ll probably need legal eyes to interpret. Hopefully, it doesn’t throw any problems in the direction of key petitioners. The Niskanen Center has already filed an appeal to the DC Circuit and the coalition’s attorney members are moving in that direction, as well.
2) JCEP has filed a Declaratory Order (roughly a petition), charging that the State of Oregon failed to action on the company’s Section 401 Water Quality Certification application within the one-year time limit specified in the Clean Water Act and thereby waived its authority to determine whether the Project would violate Oregon’s Water Quality Standards. The Department of Environmental Quality denied JCEP’s application in May 2019. A Section 401 permit is necessary for the Project to go forward, but the waiver would make the denial null. The State is working on a response. The deadline is June 4.
3) JCEP has appealed the Oregon Department of Land Conservation and Development (DLCD) Objection to the company’s Coastal Zone Management Act certification to the Secretary of Commerce, asking him to override the State’s decision. This is an allowable option in the event of an objection, but we have looked carefully at the rules governing under what circumstances the Secretary can legally perform an override and agree with the State and many others that the required circumstances don’t exist. The Oregon AG’s Office submitted the required Brief last Tuesday and we are now awaiting the next step. If an override occurs, this issue could wind up in court as well.
4) An outside, apparently well-funded national group (Consumer Energy Alliance) has created an “astroturf” (faux-grassroots) entity called the Western States and Tribal Natural Gas Initiative (WSTM) involving natural gas and LNG export proponents (e.g., western states’ local government officials, Chambers of Commerce, and some tribal groups) in the push for the JCEP. Expect to see a full-page ad in the Oregonian this Sunday, purporting to be a local and grassroots effort linking the construction of JCEP with means for economic recovery from COVID-19. News (start at 2:02:48 on the video) of this and other activities by CEA came via connections in Utah with concerns about fossil fuel development in the fracking fields there. More as this develops. As if Goliath wasn’t muscular enough already.
5) Finally, on the human side of this, here is a link to coverage of how this (the JCEP) pipeline project is affecting property owners whose land happens to lie on the proposed pipeline route. There’s a lot here. The blogs are excellent.
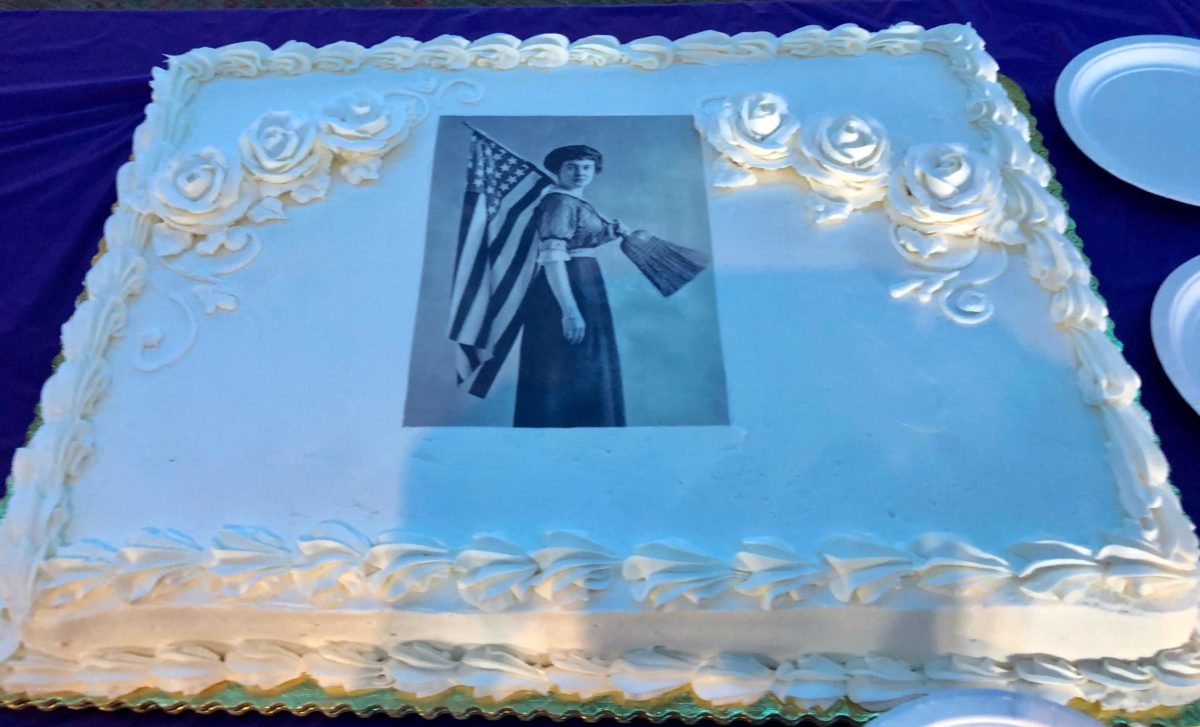
Over 160 people attended the community celebration at the Ross Ragland Theater on February 9th, 2020. LWV members wore period costumes, served wonderful cake, put on an interesting and varied show, promoted the League and its 100th anniversary.
Take a look at some of our pictures below. You will see:
Our special poster
Members in costumes
Three beautiful cakes
The lobby full of guests
Busy LWV members getting ready
Rehearsals! (Yes we did)
[Best_Wordpress_Gallery id=”4″ gal_title=”Ross Ragland February 9, 2020″]
As an official “Intervenor” in the on-going legal fights over the construction of the Pembina LNG pipeline, also known as the “Jordan Cove” pipeline, the LWV Klamath County regularly participates in various legal actions. These include filings at the federal and state level, testimony, letters, protests, and support of various parties fighting the pipeline.
Would you like to see what it looks like to build a natural gas pipeline? Have a look.
LWV Activities in 2019:
LWVOR: Jordan Cove Energy Project (JCEP)
Excerpted from recent LWVOR newsletter article. ‘Four Local Leagues of Women Voters from Coos Bay to Malin and LWVOR Call for State and Federal Agencies to Deny Permits to Jordan Cove Energy Project’, Shirley Weathers, LWVRV Climate Change Coordinator and Christine Moffitt, LWVCC Board.
“…the proposed Jordan Cove Energy Project
(JCEP)…. consisting of a 530-acre liquefied natural gas storage and
export facility known as the Jordan Cove LNG project on Coos Bay and a
230-mile 36” Pacific Connector Gas Pipeline…. Proponents see jobs
(mostly temporary) and tax revenues as benefits…. Pembina spares no
expense on high-dollar promotional efforts. Opponents, including the
four local Leagues—Coos and Klamath Counties and Rogue and Umpqua
Valley—and the LWVOR, see unacceptable negative impacts on the natural
environment from air to water to aquatic and wildlife, as well as
serious safety risks…. This joint action by the four local Leagues,
taken in solidarity with other community members and organizations and
Tribes, is a step in the long journey to stop this harmful project.…”
Jordan Cove Energy Project (JCEP) (by Shirley Weathers, LWV Rogue Valley)
As a refresher, while a significant number of key specifics about the JCEP project suggest FERC could issue Denials for the pipeline and terminal as in 2016, most observers expect approvals conditioned on receipt of certain other federal and state authorizations (please see the last issue for a summary). Such an Approval Order could include a number of other issues, making it impossible to predict all of the results and next steps. We expect a flurry of filings of Requests for Rehearing—from landowners who will then be subject to eminent domain proceedings for 90-foot easements across their properties, but also from hundreds of other individual and organizational “intervenors” on the two dockets. For example, the 4 local Leagues (Coos, Klamath, Umpqua Valley and Rogue Valley) that have been jointly opposing the project since 2017 are ready to start drafting.
some Further Explanation
It is also important to note that the State of Oregon is standing firmly against one very real possibility the FERC order may bring: one or more attempts to override state authority. Congress gave states and certain Tribes authority to protect their air, water, and coastal regions. The state permits designed to allow them to do that require input on other important matters, as well. Governor Brown has consistently maintained that all involved state agencies will exercise their permitting authority diligently and in accordance with the law. We have seen throughout this process that they have done so, despite intense pressure from project proponents and mountains of work. The Governor declared in no uncertain terms last week that Oregon will consider all available options to resist unlawful federal attempts to preempt state authority.
Highlights of Recent Activities:
Here is the latest letter that LWV Klamath along with three other local leagues sent to Governor Brown.
Because the proposed Jordan Cove LNG and Pacific Connector Gas Pipeline project would directly affect the areas of the state covered by the League of Women Voters of Coos County, LWV of Umpqua Valley, LWV of Rogue Valley, and LWV of Klamath County, our Leagues oppose this project. As Intervenors in the Federal Energy Regulatory Commission the process and discussion in this letter states some of our concerns regarding information provided to FERC by Jordon Cove Energy Project’s attorney following Oregon Department of Land Conservation and Development’s objection to JCEP’s Costal Zone Management Act (CMZM) consistency certification and FERC’s February 20, 2020 decision delay.
Here is a recent article that explains in clear language some of the issues surrounding the Jordan Cover pipeline.
People who live in Oregon could miss out on a lot if everyone is not counted in the Census. Oregon could lose out on the political representation it deserves. And people and communities could be denied money that they need for schools, community health care, jobs, and transportation.
In 2016, Oregon received more than $13 billion from federal spending programs guided by data derived from the 2010 Census. Oregon can’t afford to miss out!
2020 Census Timeline:
January through March—Education and Awareness:
● Census Bureau ad campaign goes live. ● Census Bureau begins enumeration in Remote Alaska in January 21. ● Stakeholders educate communities about the census and how they will be invited to respond (educational events, town halls, census awareness promotional content focusing on hard-to-count neighborhoods). Events will include a focus on encouraging eligible households to respond during the self-response period. ● Stakeholders deploy and educate communities about their “Get out the Count” plan (e.g., where census kiosks will be, how you are supporting communities, and what they can expect from you). ● Stakeholder groups will have “census weeks of action” for specific communities.
Mid-March through April 30: Self-Response Operation: (PEAK CENSUS OUTREACH EFFORTS)
● Census Bureau ad campaign drives a “respond-to-the-census” message. ● Census Bureau mails or hand-delivers census materials to almost all households, which will have an opportunity to respond online, by telephone, or using a paper questionnaire. (See the operations section of this toolkit for more information.) ● April 1, 2020 is Census Day—a reference date for the enumeration. ● Census Bureau enumerates group living facilities and transitory locations. ● Stakeholder groups may be going door-to-door in your community. ● The Census Bureau’s ROAM map10 and the CUNY hard-to-count map11 will display daily self-response rates by census tract. ● Stakeholders may provide devices or internet access to support people filling out their census questionnaire.
Mid-May through July: Nonresponse Follow-Up (NRFU)/Census enumerators go door-to-door:
● Census Bureau ad campaign drives “reminder, return your form” message ● Census Bureau enumerators going door to door. ● “Reminder” outreach to key hard-to-count neighborhoods. ● Census education about what enumerators look like and why they are going door-to-door.
Potential Impact of Citizenship Question Controversy
The 2020 Census will not include a citizenship question. However, people in immigrant households and communities may have heard about the Trump administration’s attempts to include a question about citizenship and legal status on the 2020 Census at the last minute. That effort was opposed by members of the Census Counts coalition and other groups who believed that such a question, especially in a climate of hostility toward immigrants, could discourage participation.
In June 2019, the Supreme Court stopped the Secretary of Commerce (who oversees the Census Bureau) from moving forward with the citizenship question, finding that the administration’s justification for asking the question was not credible. This was a major victory, but some advocates worry that the controversy has already harmed the credibility of the 2020 Census, particularly in Latino, Asian, and other immigrant communities. The NALEO Education Fund’s ¡Hágase Contar! (Make Yourself Count!) Campaign is operating a toll-free bilingual hotline 877-EL-CENSO (877-352-3676) as part of its national effort to overcome the effort to suppress the count of Latinos.
The 2020 Census is right around the corner. The information it collects will have substantial and lasting impacts on the nation’s governance and economy. In particular, data derived from the decennial census are used by the federal and state governments to guide where public funds are allocated. A lot of funds. Census-derived data are used to annually distribute approximately $900 billion to states, counties, cities, and households.
To ensure that each community receives its fair share of federal funds, an accurate 2020 Census is necessary. So that communities across the U.S. can better understand how an accurate census affects their receipt of federal assistance funds, this brief describes the geographic allocation of five census-guided federal programs important to local communities.
Millions of people, including community groups, local officials, and businesses rely on the Census to provide accurate, comprehensive data about our nation that impacts us all:
Census data is the basis for fair political representation, and this data is used to draw district lines reflective of the population.
Community leaders use Census data to allocate resources, including public safety, planning and disaster response, education needs, hospitals, assistance for veterans, and transportation.
Business leaders use Census data to make investment decisions that boost economic growth.
We only get one chance every ten years to get this right. The Census must be done fairly and accurately.
What is the League doing to ensure the most accurate count in the 2020 Census?
The League has a three-phase plan around census: Education, Get-Out-The-Count, and Watchdog activities.
In the months leading up to Census Day—April 1, 2020—Leagues around
the country will be in communities sharing information and resources
about how to participate and the importance of the U.S. Census.
On Census Day, the League will work in coalition to help get everyone
counted, are working in Complete Count Committees to share out
information about low-reporting areas and communicate where additional
support is needed.
Once the Census count wraps up in the Summer of 2020, the League will
remain in communities and will act as a watchdog for any issues from
the ground.
One of the main functions of the LWV is to promote voter participation. Voters should be educated about candidates and issues.
Educating Voters
The LWV hosts hundreds of events and programs every year to educate voters about candidates in thousands of federal, state and local races, as well as distribute millions of educational materials about state and local elections.
Why it matters
The leaders we elect make decisions that affect our daily
lives. Elections are our chance to stand up for what matters most
to us and to have an impact on the issues that affect us, our
communities, our families and our future.
What we’re doing
The LWV hosts hundreds of candidate debates and forums across the country each year and provide straightforward information about candidates and ballot issues. Through print and online resources, including VOTE411.org, we equip voters with essential information about the election process in each state, including polling place hours and locations, ballot information, early or absentee voting rules, voter registration deadlines, ID requirements and more.
Candidates’ Forum in Klamath Falls
The League of Women Voters of Klamath County will hold a Candidates’ Night at the Klamath County Public Library on Tuesday, April 14 from 6 – 9 pm. It is co-sponsored by the Library. We would like all voters to participate, no matter your party affiliation.
Our organization is Non-Partisan. This is not a debate. It is an opportunity for Klamath County voters to hear all candidates who choose to participate, and allows them to answer written questions from you, our audience.
We will invite all 13 candidates, from all parties, for the Congressional seat in District 2, as well as local candidates in contested races (currently Sheriff and County Commissioners). We hope you will come to listen and ask questions.
Election rules differ state by state, and sometimes change from year
to year. Using VOTE411.org, voters can confirm their polling location,
check if ID is required, and see what their personal ballot will look
like. Confirming this information before heading to the polls saves
voters time and helps voters make more informed decisions.
What we’re doing
We have long been a trusted source of objective and nonpartisan
election information. Since 2006, VOTE411.org has served tens of
millions of voters. By entering one’s home address on VOTE411.org,
voters can see ballot questions they will be voting on, compare
candidate responses to League questions and much more!
League of Women Voters and
Harvard University partner to train local history teachers
COMMUNITY LEADERS, ELECTED OFFICIALS AND ALL INTERESTED PERSONS ARE INVITED
LEAGUE OF WOMEN VOTERS OF KLAMATH COUNTY and Klamath Community College is sponsoring a PUBLIC SEMINAR based on HARVARD UNIVERSITY’S CASE STUDY METHODOLOGY
COME AND
LEARN FROM SPECIALLY TRAINED TEACHERS
TOPIC
OF STUDY:
PRESIDENT MADISON,
THE ‘FEDERAL NEGATIVE’ AND THE MAKING OF THE U.S. CONSTITUTION
HOSTED
BY :
Klamath
Union: Jonathan Chenjeri
Mazama
High School: Kelly Patzke, Laura Estes
Lost
River High School: Kjirsten
Spark-Stahl
Paisley
High School: Courtney
Wertz
SATURDAY MAY 16, 2020, 2:00- 4:00 PM Klamath Community College,KLAMATH FALLS, OREGON
*Note
all participants must provide a valid email address to receive study
materials one month before the seminar. Participants are expected to
read the materials provided and be prepared to engage with fellow
attendees under the direction of the teacher leaders, using Harvard’s
case study method.
background and press release
In August of 2019, the
League of Women Voters of Oregon sent 13 Oregon high school history
and government teachers to a three-day training course at Harvard
University as part of a nation-wide curriculum development program. 5
of the Oregon teachers came from the Klamath Basin region: one from
Klamath Union HS, two from Mazama HS, one from Lost River HS, and one
from Paisley HS. These five teachers are currently using their new
materials based on historical case studies in their classes and find
it challenging and invigorating for their students. In May, 2020
these five teachers will offer a public forum using their new
teaching methods so the community can experience the lessons of
President Madison’ tenure as they apply to our country today.
Harvard University’s
Business School developed their case method project to bring this
professional development opportunity to high school teachers across
the U.S. Their aim is to deepen students’ understanding of American
democracy. Based on the highly successful experience of Harvard
Business School and other graduate and professional programs that use
case-based teaching, they believe this method can be employed to
strengthen high school education, ensuring a more exciting, relevant,
and effective experience for students and teachers, especially for
students in history and democracy classes. Harvard University
believes it presents a unique opportunity to help reverse the broad
decline in civic education – and civic engagement – in the United
States. Each case study explores a key decision point in the history
of American democracy.
This year for the first time, Oregon participated by sending 13 teachers from across the state. Now the public in the Klamath Basin will be able to benefit from the teachers’ new skills by sitting in a two-hour actual study session, where they prepare by reading the study materials and then sit with others to discuss it under the teachers’ direction, much like their students did in their classes this year. This will be a one-time unique opportunity for community education directly from Harvard University, sponsored by the League of Women Voters of Klamath County and Klamath Community College.
From 2017-2019 the League of Women Voters of Klamath County engaged in a study of local issues surrounding immigration and criminal justice in Klamath County. A number of sources were interviewed, and a complete report has now been prepared. Here is its introduction:
In January
2017, LWVKC Board discussed immigration issues, especially regarding
DACA (Deferred Action for Childhood Arrivals) people, as a result of
national news.
In September,
2017, they again addressed the question of DACA recipients in
Klamath County, based on a meeting with the ROP (Rural Organizing
Project), in which the question was raised about how to help local
Latinx migrants. Attendees at that meeting
a) sought to
find out about ICE (Immigration
and Customs Enforcement) work
in Klamath County,
b) wanted to
hold local law enforcement accountable for sanctuary state behavior,
and
c) wanted to
make sure that policies were in place that would respect the
constitutional rights of all migrants.
The LWVKC
Board took this issue as a study focus in May, 2018, because there
were new concerns regarding the well being of the Klamath County
Latinx. The study proceeded based on the LWV US position on
immigration, which states “Immigration policies should promote
reunification of immediate families; meet economic, business and
employment needs; and be responsive to those facing political
persecution or humanitarian crises”.
Over the next 15 months, various Board members interviewed eight members of the local law enforcement system and others involved in affairs of the Latinx community in Klamath County. As it became apparent that there was no local need for immediate help for DACA recipients, the focus of inquiry shifted from DACA recipients to a broader look at how the justice and immigration system for both adults and juveniles plays out in the Latinx community and the community at large in Klamath County.
Here is the conclusion:
General
Conclusions
All
informants discussed the difficulty in managing crime, punishment,
drug abuse, and mental health issues and indicated that the Latinx
population in particular is more difficult to manage based on lack of
English skills. All parties stressed that immigration status in not a
factor in the way agencies interact with the public or their charges,
despite the fact that some in the Latinx community perceive
otherwise.
Everyone
pointed to a lack of adequate funding and manpower in their agencies,
a common complaint. They sounded genuine in their desire to improve
the justice system from their agency’s perspective. It is clear that
these various agencies partner together very well to use available
resources.
NPV seeks to ensure that the presidential candidate who wins the most
popular votes nationwide is elected president. When a state passes
legislation to join the National Popular Vote Compact, it pledges that
all of that state’s electoral votes will be given to whichever
presidential candidate wins the popular vote nationwide, rather than the
candidate who won the vote in just that state.
These bills will take effect only when states with a majority of the
electoral votes have passed similar legislation and joined the
compact. States with electoral votes totaling 270 of the 538 electoral
votes would have to pass NPV bills before the compact kicks in and any
state’s bill could take effect.
Agreement Among the States to Elect the President by National Popular Vote
The National Popular Vote Interstate Compact will guarantee the Presidency to the candidate who receives the most popular votes across all 50 states and the District of Columbia. The Compact ensures that every vote, in every state, will matter in every presidential election. The Compact is a state-based approach that preserves the Electoral College, state control of elections, and the power of the states to control how the President is elected.
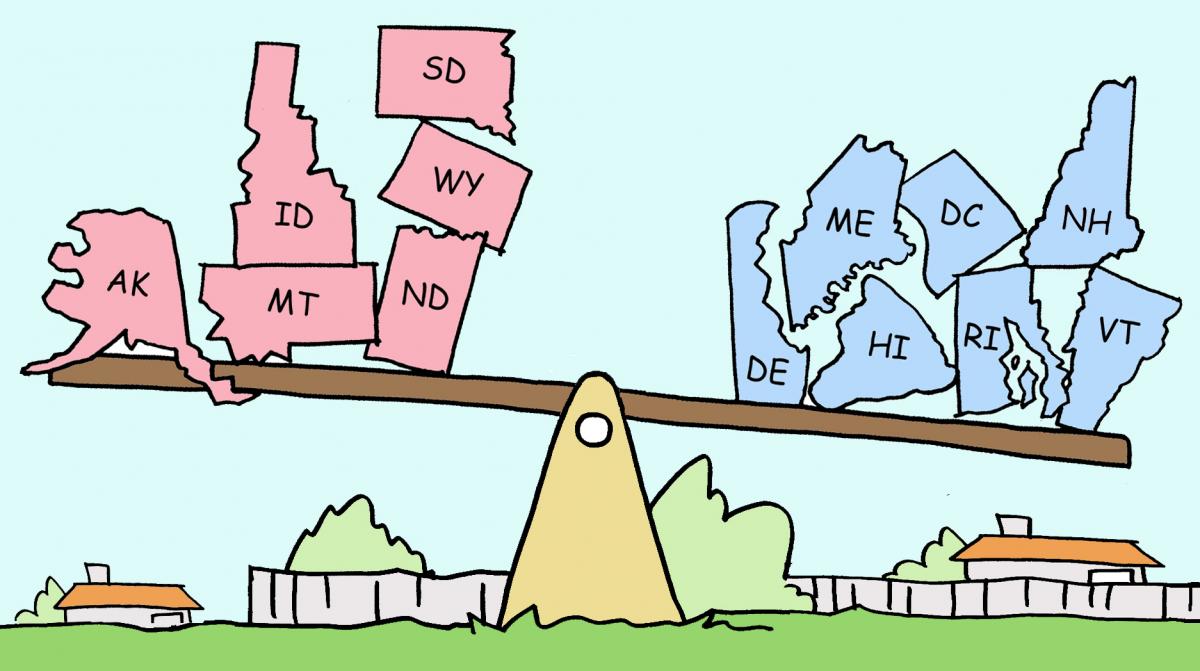
The National Popular Vote bill has been enacted by 16 jurisdictions
possessing 196 electoral votes, including 4 small states (DE, HI, RI,
VT), 8 medium-sized states (CO, CT, MD, MA, NJ, NM, OR, WA), 3 big
states (CA, IL, NY), and the District of Columbia. The bill will take
effect when enacted by states with 74 more electoral votes. The bill
has passed at least one chamber in 8 additional states with 75 more
electoral votes (AR, AZ, ME, MI, MN, NC, NV, OK). A total of 3,408
state legislators from all 50 states have endorsed it.
The shortcomings of the current system of electing the President stem
from “winner-take-all” laws that have been enacted by state
legislatures in 48 states. These laws award all of a state’s electoral
votes to the candidate receiving the most popular votes in each state.
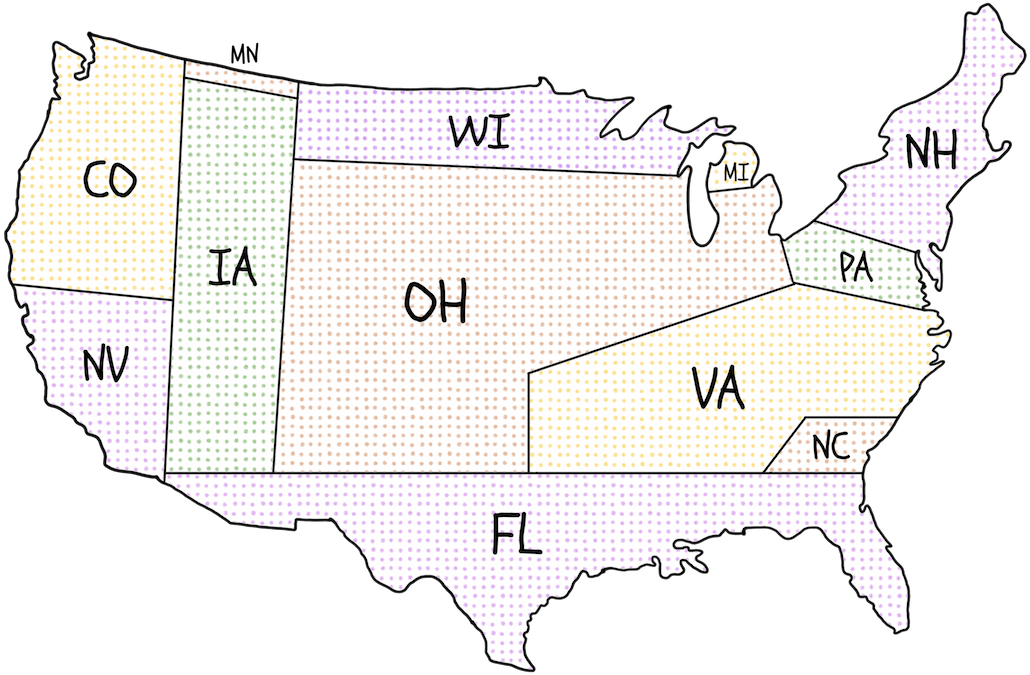
Because of these state winner-take-all statutes, presidential candidates have no reason to pay attention to the issues of concern to voters in states where the statewide outcome is a foregone conclusion. In 2012, as shown on the map, all of the 253 general-election campaign events were in just 12 states, and two-thirds were in just 4 states (Ohio, Florida, Virginia, and Iowa). Thirty-eight states were completely ignored.
Campaign events in 2012
Here’s
a map of US with state sizes based on the number of campaign events in
2012. This is how the candidates view the relevant voters (and their
issues). Notice that 38 states are missing altogether:
State sizes based on campaign events in 2012
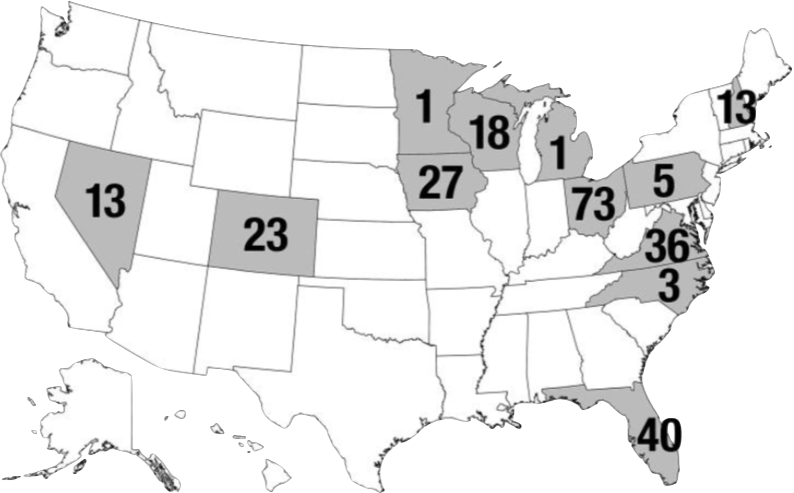
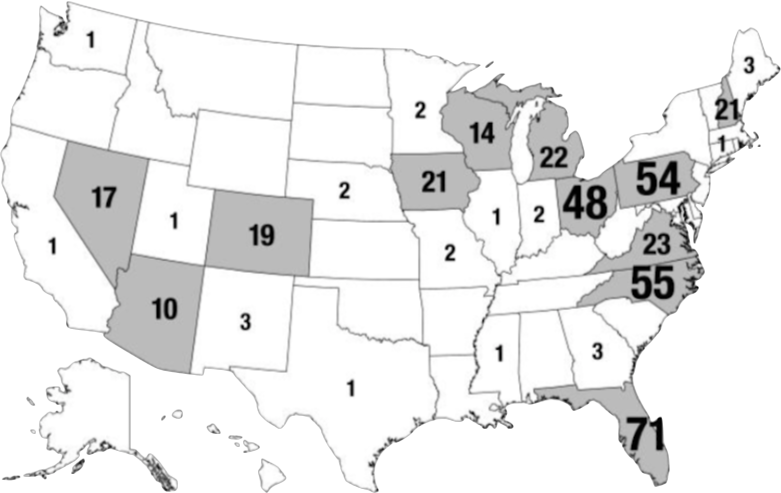
Similarly,
in 2016, almost all campaign events (94%) were in the 12 states where
Trump’s support was between 43% and 51%. Two-thirds of the events (273
of 399) were in just 6 states (OH, FL, VA, NC, PA, MI).
Campaign events in 2016
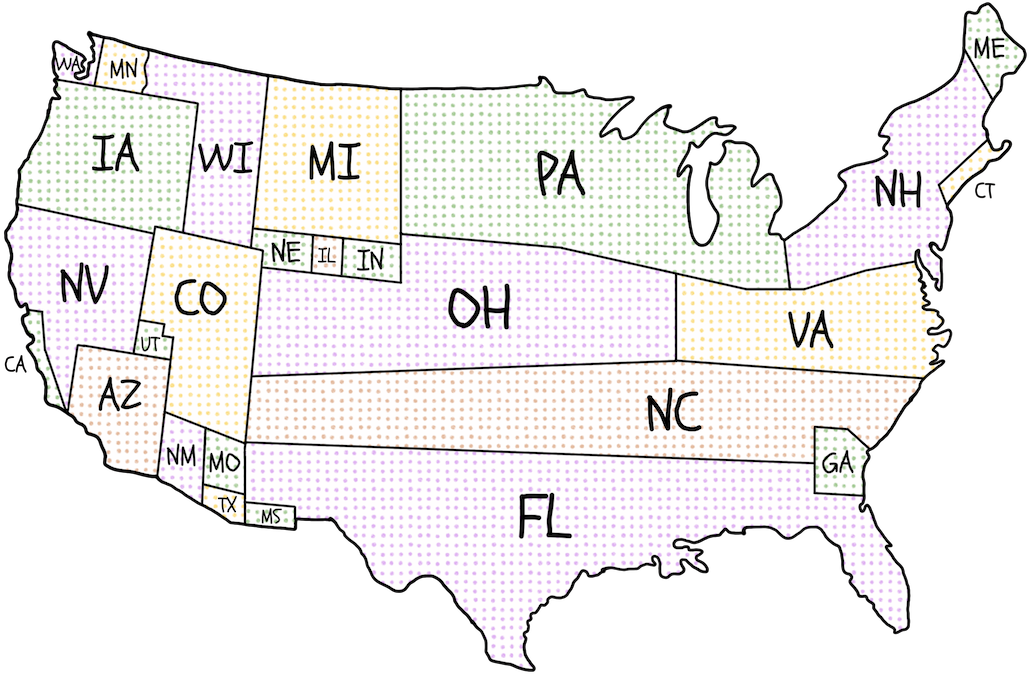
This
is how the US map looks with state sizes based on the number of
campaign events in 2016 (missing states received no campaign events):
State sizes based on campaign events in 2016
State
winner-take-all statutes adversely affect governance. “Battleground”
states receive 7% more federal grants than “spectator” states, twice as
many presidential disaster declarations, more Superfund enforcement
exemptions, and more No Child Left Behind law exemptions.
Also, because of state winner-take-all statutes, five of our 45
Presidents have come into office without having won the most popular
votes nationwide. The 2000 and 2016 elections are the most recent
examples of elections in which a second-place candidate won the White
House. Near-misses are also common under the current state-by-state
winner-take-all method of awarding electoral votes. A shift of 59,393
votes in Ohio in 2004 would have elected John Kerry despite President
Bush’s nationwide lead of over 3,000,000 votes.
The U.S. Constitution (Article II, Section 1) gives the states
exclusive control over awarding their electoral votes: “Each State shall
appoint, in such Manner as the Legislature thereof may direct, a Number
of Electors….” The winner-take-all method of awarding electoral votes
is state law. It is not in the U.S. Constitution. The winner-take-all
rule was used by only three states in 1789, and all three repealed it by
1800. It was not until the 11th presidential election (1828) that even half the states used winner-take-all laws.
The National Popular Vote interstate compact will go into effect when
enacted by states possessing a majority of the electoral votes—that is,
enough to elect a President (270 of 538). At that time, every voter in
the country will acquire a direct vote for a group of at least 270
presidential electors supporting their choice for President. All of
this group of 270+ presidential electors will be supporters of the
candidate who received the most popular votes in all 50 states and
DC—thus making that candidate President.
In contrast, under the current system, a voter has a direct voice in
electing only the small number of presidential electors to which their
state is entitled. Under NPV, every voter directly elects 270+
electors.
Additional information is available in the book Every Vote Equal: A State-Based Plan for Electing the President by National Popular Vote and at www.NationalPopularVote.com.
Learn More
Click on any of the topics below to learn more. You can also read about the numerous myths.
Today, 48 states (all except Maine and Nebraska) have a so-called “winner-take-all” law that awards all of a state’s electors to the presidential candidate who gets the most popular votes inside each separate state.
These winner-take-all laws are state laws—they are not
part of the U.S. Constitution. The winner-take-all method of choosing
presidential electors was never debated by the 1787 Constitutional
Convention or mentioned in the Federalist Papers.
Only three states had winner-take-all laws in the first
presidential election in 1789, and all three repealed them by 1800. In
1789, electors were chosen from congressional districts in
Massachusetts, from special presidential-elector districts in Virginia,
and by counties in Delaware. The Governor and his Council appointed the
state’s presidential electors in New Jersey. State legislatures
appointed presidential electors in the other states.
In the nation’s first competitive presidential election in 1796,
Jefferson lost the Presidency by three electoral votes because
presidential electors were chosen by district in the heavily
Jeffersonian states of Virginia and North Carolina, and Jefferson lost
one district in each state.
On January 12, 1800, Thomas Jefferson wrote James Monroe (then governor of Virginia):
“On the subject of an
election by a general ticket [winner-take-all], or by districts, … all
agree that an election by districts would be best, if it could be
general;but while 10 states choose either by their legislatures or by a general ticket [winner-take-all],it is folly and worse than follyfor the other 6 not to do it.”
As a result, Virginia quickly passed a winner-take-all law in time for the 1800 election—thereby assuring Jefferson of all the state’s electoral votes.
Meanwhile, the Federalist majority in the legislature of John
Adam’s home state of Massachusetts—alarmed by rising support for
Jefferson in the state—repealed the state’s district system—thereby
assuring John Adams of all the state’s electoral votes in 1800.
This triggered a domino effect in which each state’s dominant
political party adopted winner-take-all so that it could deliver the
maximum number of electoral votes to its party’s nominee. Ten states
enacted winner-take-all by 1824 when Missouri Senator Thomas Hart Benton
said:
now existing in 10 States was … not [the offspring] of any disposition to give fair play to the will of the people. It was adopted by the leading men of those states, to enable them to consolidate the vote of the State.”
By 1836, all but one state had enacted laws specifying that
their state’s voters would vote for presidential electors on a
winner-take-all basis. By 1880, all states were using this system.
In 1888, incumbent Democratic President Cleveland won the national
popular vote, but lost the electoral vote. When Democrats won control
of the legislature in the then-regularly-Republican state of Michigan in
1890, they replaced winner-take-all with district election of
presidential electors. The Republicans challenged the Democrat’s change.
In 1892, the U.S. Supreme Court upheld district elections and ruled in McPherson v. Blacker:
“The constitution does not
provide that the appointment of electors shall be by popular vote, nor
that the electors shall be voted for upon a general ticket [i.e., the
winner-take-all rule], nor that the majority of those who exercise the
elective franchise can alone choose the electors. … In short, the appointment and mode of appointment of electors belong exclusively to the states under the constitution of the United States.”
The Republicans restored winner-take-all in Michigan as soon as they regained control of the state legislature.
Maine adopted district elections for its electors in 1969, and Nebraska did so in 1992.
Massachusetts has changed its method of appointing electors 11 times.
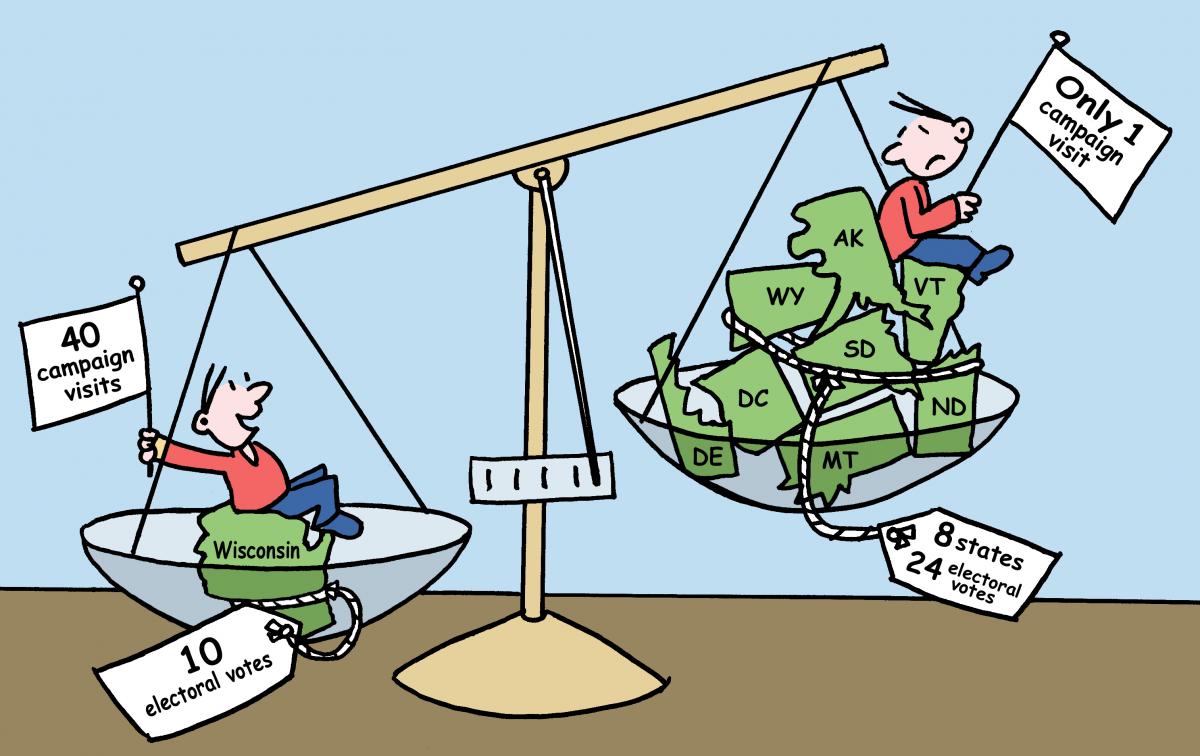
Contrary to what some may think, the current state-by-state winner-take-all method of awarding electoral votes decreases the political clout of small states in presidential elections.
The eight smallest states (i.e., those with three electoral votes, including DC) together
received only one of the nation’s 952 general-election campaign events
in the 2008, 2012, and 2016 elections. In contrast, the closely divided
battleground state of Wisconsin (with about the same population as the
eight smallest states) received 40 events. Wisconsin received more
attention despite having only 10 electoral votes—compared to 24
electoral votes for the eight states.
Presidential candidates ignore the smallest states—not because
they are small—but because they are one-party states in presidential
elections. Under the current state-by-state winner-take-all method of
awarding electoral votes political power comes from being a closely
divided battleground state.
The 13 smallest states (i.e., those with three or four electoral
votes, including DC) are not predominantly Republican in presidential
elections. In fact, these 13 jurisdictions have split 7-to-6 (or 8-to-5)
in favor of the Democrats in all but one presidential election since
1992 (and 6-to-7 Republicans once).
President Trump did not win the Electoral College in 2016
because of small states. All of the 13 smallest states gave their
electoral votes to the same party in 2016, 2012, 2008, and 2004 (except
for President Trump receiving one electoral vote in Maine by winning its
2nd congressional district). Even if the 25
smallest states are considered, Iowa was the only state to switch
parties between 2012 and 2016, and Iowa’s six electoral votes alone did
not elect Trump.
The fact that the small states are disadvantaged by the current
state-by-state winner-take-all system has been long recognized by
prominent officials from these states. In 1966, Delaware led a group of
12 predominantly small states in an effort to get state winner-take-all
laws declared unconstitutional.
Another indication that small states do not benefit from the
current system is that Delaware, Hawaii, Rhode Island, Vermont, and the
District of Columbia are among the 16 jurisdictions that have enacted
the National Popular Vote interstate compact into law.
The current state-by-state winner-take-all system actually shifts
power from small and medium-sized states to an accidental handful of
closely divided battleground states.
A nationwide vote for President offers a way for small states to
become relevant in presidential elections by making every one of their
voters count directly toward the presidential candidate of their choice.
How would candidates campaign in a nationwide election for President
in which every vote is equal and the winner is the candidate receiving
the most popular votes throughout the entire United States?
Some people have speculated that a national popular vote for
President would cause campaigns to concentrate disproportionately on
heavily populated metropolitan areas and ignore rural areas.
However, there is no need to speculate about whether candidates would do this.
If there were any tendency for candidates to overemphasize big
cities or ignore rural areas, we would see evidence of that tendency in
the way campaigns are actually conducted today in the dozen or so closely divided “battleground” states where presidential campaigns take place.
Here are the facts as to how candidates actually campaigned for the votes of the 95 million people living inside the dozen closely divided battleground states:
The biggest metro areas of the battleground states actually
received a combined total of 191 general-election campaign visits—
compared to 188 if visits had been based strictly on population.
The areas outside each state’s biggest metro area received 427
visits— compared to 430 if visits had been based strictly on population.
In other words, real-world candidates hew closely to population
when allocating campaign visits within battleground states—indeed they
did so with almost surgical precision. Presidential candidates—advised
by the nation’s most astute political strategists—campaign in this
manner because every vote inside a battleground state is equal, and
because the candidate receiving the most popular votes inside the state
wins everything. There is no evidence that big metro areas exert any
magnetic or intoxicating attraction causing candidates to concentrate
disproportionately on heavily populated metropolitan areas or ignore
rural areas.
For more details on how a nationwide presidential campaign would be run, see this memo.
Large cities will not dominate a national popular vote – they are
simply not as large as some people think compared to the entire
population of the country:
The biggest 100 cities contain just one-sixth of the U.S. population (16%), and they voted 63% Democratic in 2004.
The rural areas (i.e., places outside the nation’s Metropolitan
Statistical Areas) contain one-sixth of the U.S. population, and they
voted 60% Republican in 2004. That is, the biggest cities are almost
exactly balanced out by rural areas in terms of population and partisan
composition.
The remaining two thirds of the U.S. population live inside a
Metropolitan Statistical Area (MSA), but outside the central city. These
suburban areas are evenly divided politically.
You can read more about the myths of big cities.
As was discussed in the previous section, a close analogy for a
national campaign is studying presidential campaigns in battleground
states, where they do indeed campaign in cities, suburban and rural
areas. While rural areas have lower population density, advertising and
campaigning costs in those areas tend to be significantly lower than urban areas. The candidates need to win votes in all those areas to succeed overall.
Here are the number of general-election presidential campaign events
(between the party convention and the general election) by state for
the 2008, 2012 and 2016 elections:
Electoral votes
State
2008 events
2012 events
2016 events
9
Alabama
3
Alaska
11
Arizona
10
6
Arkansas
55
California
1
9
Colorado
20
23
19
7
Connecticut
1
3
D.C.
1
3
Delaware
29
Florida
46
40
71
16
Georgia
3
4
Hawaii
4
Idaho
20
Illinois
1
11
Indiana
9
2
6
Iowa
7
27
21
6
Kansas
8
Kentucky
8
Louisiana
4
Maine
2
3
10
Maryland
11
Massachusetts
16
Michigan
10
1
22
10
Minnesota
2
1
2
6
Mississippi
1
10
Missouri
21
2
3
Montana
5
Nebraska
2
6
Nevada
12
13
17
4
New Hampshire
12
13
21
14
New Jersey
5
New Mexico
8
3
29
New York
15
North Carolina
15
3
55
3
North Dakota
18
Ohio
62
73
48
7
Oklahoma
7
Oregon
20
Pennsylvania
40
5
54
4
Rhode Island
9
South Carolina
3
South Dakota
11
Tennessee
1
38
Texas
1
6
Utah
1
3
Vermont
13
Virginia
23
36
23
12
Washington
1
5
West Virginia
1
10
Wisconsin
8
18
14
3
Wyoming
538
Total
300
253
399
In 2008, only 3 of the 13 smallest states (3 or 4
electoral votes) received any of the 300 general-election campaign
events. The closely divided battleground state of New Hampshire received
12 events. Maine (which awards electoral votes by congressional
district) received 2 events. The District of Columbia received one
event. All the other states in this group were ignored. The small
states are ignored not because they are small, but because (except for
New Hampshire), they are one-party states in presidential elections.
In 2008, only 7 of the 25 smallest states (7 or fewer
electoral votes) received any of the general-election campaign events.
New Hampshire, Iowa, and Nevada each received a substantial number of
events (12, 7, and 12, respectively). New Mexico (a battleground state
at the time) received 8 events. West Virginia and the District of
Columbia received 1 event each. All the other small states in this group
were ignored.
In 2012, only 1 of the 13 smallest states (3 or 4 electoral
votes) received any of the 253 general-election campaign events, namely
the closely divided battleground state of New Hampshire. All the other
states in this group were ignored.
In 2012, only 3 of the 25 smallest states (7 or fewer
electoral votes) received any of the general-election campaign events.
All the other small states were ignored. The 3 states that received
attention were the closely divided battleground states of New Hampshire,
Iowa, and Nevada. All the other states in this group were ignored.
In 2016, only 2 of the 13 smallest states (3 or 4 electoral
votes) received any of the 399 general-election campaign events. New
Hampshire received 21 because it was a closely divided battleground
state. Maine (which awards electoral votes by congressional district)
received 3 campaign events because its 2nd congressional district was closely divided (and, indeed, Trump carried it). All the other states in this group were ignored.
In 2016, only 9 of the 25 smallest states (7 or fewer
electoral votes) received any general-election campaign events. New
Hampshire, Iowa, and Nevada received attention because they were closely
divided battleground states. Maine and Nebraska (which award electoral
votes by congressional district) received some attention, since one of
their congressional districts was closely divided. New Mexico received
some attention (from the Republican campaign only) because former New
Mexico Governor Johnson was running for President and it appeared his
strong home-state support might make the state competitive. Utah
received some attention from Republicans because the McMullin candidacy
might have made the state competitive. Connecticut and Mississippi also
received one campaign event. All the other small states in this group
were ignored.
Another way to look at why states are ignored in presidential
elections is to see which states consistently vote for one party or the
other. This table shows that 16 states voted Democratic and 22 states
voted Republican in all five presidential elections from 2000–2016.
Because of the winner-take-all approach that states use to assign their
electoral votes, these states, plus some of the others, are almost
certain to deliver all their electoral votes to one candidate or the
other, and therefore are ignored by the candidates.
Dem 5/5
16 states
Dem 4/5
5 states
Dem 3/5
4 states
Dem 2/5
2 states
Dem 1/5
2 states
Dem 0/5
22 states
CA (55)
MI (16)
VA (13)
FL (29)
IN (11)
AL (9)
CT (7)
NH (4)
CO (9)
OH (18)
NC (15)
AK (3)
DE (3)
NM (5)
NV (6)
AR (6)
DC (3)
PA (20)
IA (6)
AZ (11)
HI (4)
WI (10)
GA (16)
IL (20)
ID (4)
MA (11)
KS (6)
ME (4)
KY (8)
MD (10)
LA (8)
MN (10)
MO (10)
NJ (14)
MS (6)
NY (29)
MT (3)
OR (7)
NE (5)
RI (4)
ND (3)
VT (3)
OK (7)
WA (12)
SC (9)
SD (3)
TN (11)
TX (38)
UT (6)
WY (3)
WV (5)
196 EV
55 EV
34 EV
47 EV
26 EV
180 EV
Note: The number of electoral votes
shown are for 2012, 2016, and 2020 elections. DC is counted as a state
for purposes of this chart.
The states are listed below in order of Romney’s 2012
percentage—with the most Republican (red) states at the top. All of the
253 General-Election Campaign Events in 2012 occurred in states where
Romney’s percentage of the two-party vote was between 45% and 51%.
The second column shows the total number of general-election campaign events for each state (out of a nationwide total of 253).
The only states that received any campaign events (second column)
and any significant ad money (third column) were the 12 states (shown in
black in the middle of the table) where the Romney received between 45%
and 51% of the vote—that is, within 3 points of his nationwide
percentage of 48%. Only 8 states received more than a handful of
campaign events.
Only 1 of the 13 smallest states (with 3 or 4 electoral votes)
received any of the 253 general-election campaign events, namely the
closely divided battleground state of New Hampshire. All the other
states in this group were ignored. Only 3 of the 25 smallest states
(with 7 or fewer electoral votes) received any of the general-election
campaign events. All the other small states were ignored. The 3 states
that received attention were the closely divided battleground states of
New Hampshire, Iowa, and Nevada.
The fourth column in the table shows donations from each state (scroll the table left to see all the columns).
In 2016, there were 399 general-election campaign events. Almost all
campaign events (94%) were in the 12 states where Trump’s support was
between 47% and 55% of the two-party vote. Two-thirds of the events (273
of 399) were in just 6 states (OH, FL, VA, NC, PA, MI).
12 battleground states in 2016 accounting for 94% of the campaign events (375 of 399)
Trump %
Events
State
Trump
Clinton
R-Margin
D-Margin
R-EV
D-EV
Population
55%
21
Iowa
800,983
653,669
147,314
6
3,053,787
54%
48
Ohio
2,841,006
2,394,169
446,837
18
11,568,495
52%
55
North Carolina
2,362,631
2,189,316
173,315
15
9,565,781
52%
10
Arizona
1,252,401
1,161,167
91,234
11
6,412,700
51%
71
Florida
4,617,886
4,504,975
112,911
29
18,900,773
50%
14
Wisconsin
1,405,284
1,382,536
22,748
10
5,698,230
50%
54
Pennsylvania
2,970,733
2,926,441
44,292
20
12,734,905
50%
22
Michigan
2,279,543
2,268,839
10,704
16
9,911,626
49.8%
21
New Hampshire
345,790
348,526
2,736
4
1,321,445
49%
17
Nevada
512,058
539,260
27,202
6
2,709,432
47%
19
Colorado
1,202,484
1,338,870
136,386
9
5,044,930
47%
23
Virginia
1,769,443
1,981,473
212,030
13
8,037,736
51%
375
22,360,242
21,689,241
125
32
94,959,840
Notes: (1) Trump percentage is of the two-party vote (2) Population is from 2010 census.
Only 2 of the 13 smallest states (with 3 or 4 electoral votes)
received any of the 399 general-election campaign events. New Hampshire
received 21 because it was a closely divided battleground state. Maine
(which awards electoral votes by congressional district) received 3
campaign events because its 2nd congressional district was closely
divided (and, indeed, Trump carried it). All the other states in this
group were ignored.
Only 9 of the 25 smallest states (with 7 or fewer electoral votes)
received any general-election campaign events. New Hampshire, Iowa, and
Nevada received attention because they were closely divided battleground
states. Maine and Nebraska (which award electoral votes by
congressional district) received some attention since just one of their
congressional districts was closely divided. New Mexico received some
attention (from the Republican campaign only) because former New Mexico
Governor Johnson was running for President and it appeared his strong
home-state support might make the state competitive. Utah received some
attention from Republicans because the McMullin candidacy might have
made the state competitive. Connecticut and Mississippi also received
one campaign event. All the other small states in this group were
ignored.
39 spectator states in 2016 accounting for 6% of the campaign events (24 of 399)
Trump %
Events
State
Trump
Clinton
R-Margin
D-Margin
R-EV
D-EV
Population
76%
0
Wyoming
174,419
55,973
118,446
3
568,300
72%
0
West Virginia
489,371
188,794
300,577
5
1,859,815
70%
0
North Dakota
216,794
93,758
123,036
3
675,905
69%
0
Oklahoma
949,136
420,375
528,761
7
3,764,882
68%
0
Idaho
409,055
189,765
219,290
4
1,573,499
66%
0
South Dakota
227,721
117,458
110,263
3
819,761
66%
0
Kentucky
1,202,971
628,854
574,117
8
4,350,606
64%
0
Alabama
1,318,255
729,547
588,708
9
4,802,982
64%
0
Arkansas
684,872
380,494
304,378
6
2,926,229
64%
0
Tennessee
1,522,925
870,695
652,230
11
6,375,431
64%
2
Nebraska
495,961
284,494
211,467
5
1,831,825
62%
1
Utah
515,231
310,676
204,555
6
2,770,765
61%
0
Kansas
671,018
427,005
244,013
6
2,863,813
61%
0
Montana
279,240
177,709
101,531
3
994,416
60%
0
Louisiana
1,178,638
780,154
398,484
8
4,553,962
60%
2
Indiana
1,557,286
1,033,126
524,160
11
6,501,582
60%
2
Missouri
1,594,511
1,071,068
523,443
10
6,011,478
59%
1
Mississippi
700,714
485,131
215,583
6
2,978,240
58%
0
Alaska
163,387
116,454
46,933
3
721,523
57%
0
South Carolina
1,155,389
855,373
300,016
9
4,645,975
55%
1
Texas
4,685,047
3,877,868
807,179
38
25,268,418
53%
3
Georgia
2,089,104
1,877,963
211,141
16
9,727,566
49%
2
Minnesota
1,323,232
1,367,825
44,593
10
5,314,879
48%
3
Maine
335,593
357,735
22,142
1
3
1,333,074
45%
3
New Mexico
319,667
385,234
65,567
5
2,067,273
44%
0
Delaware
185,127
235,603
50,476
3
900,877
44%
0
Oregon
782,403
1,002,106
219,703
7
3,848,606
43%
1
Connecticut
673,215
897,572
224,357
7
3,581,628
43%
0
New Jersey
1,601,933
2,148,278
546,345
14
8,807,501
42%
0
Rhode Island
180,543
252,525
71,982
4
1,055,247
41%
1
Washington
1,221,747
1,742,718
520,971
12
6,753,369
41%
1
Illinois
2,146,015
3,090,729
944,714
20
12,864,380
38%
0
New York
2,819,557
4,556,142
1,736,585
29
19,421,055
36%
0
Maryland
943,169
1,677,928
734,759
10
5,789,929
35%
0
Massachusetts
1,090,893
1,995,196
904,303
11
6,559,644
35%
0
Vermont
95,369
178,573
83,204
3
630,337
34%
1
California
4,483,814
8,753,792
4,269,978
55
37,341,989
33%
0
Hawaii
128,847
266,891
138,044
4
1,366,862
4%
0
D.C.
12,723
282,830
270,107
3
601,723
48%
24
40,624,892
44,164,411
181
200
214,825,346
Notes: (1) Trump percentage is of the two-party vote (2) Population is from 2010 census.
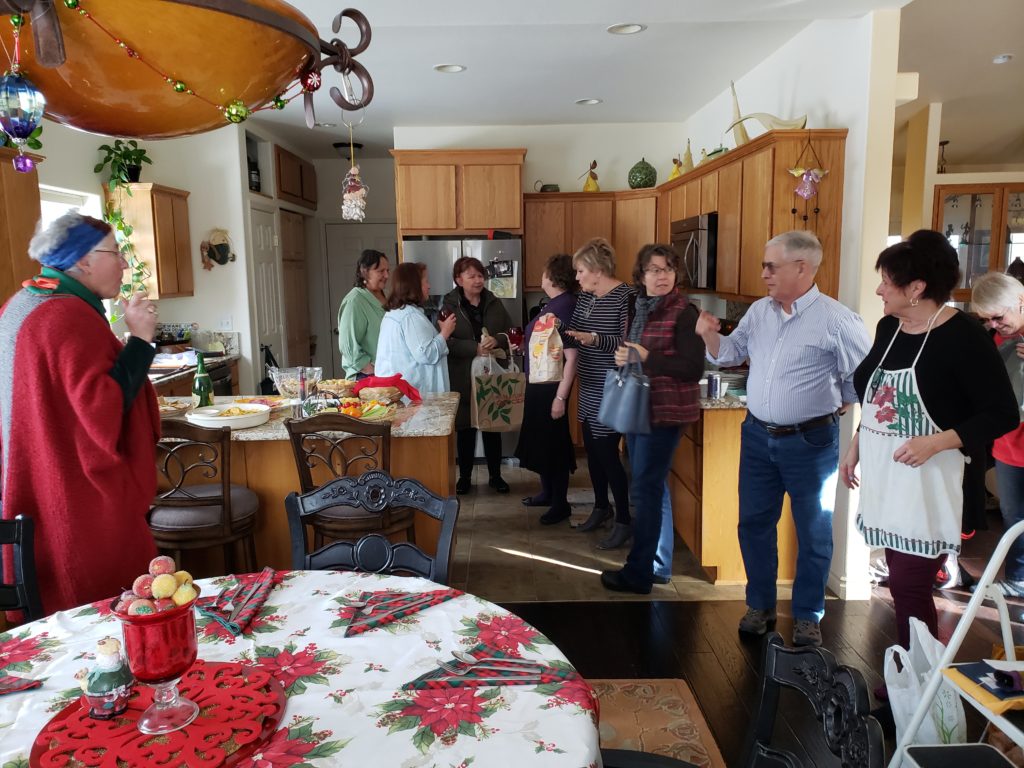
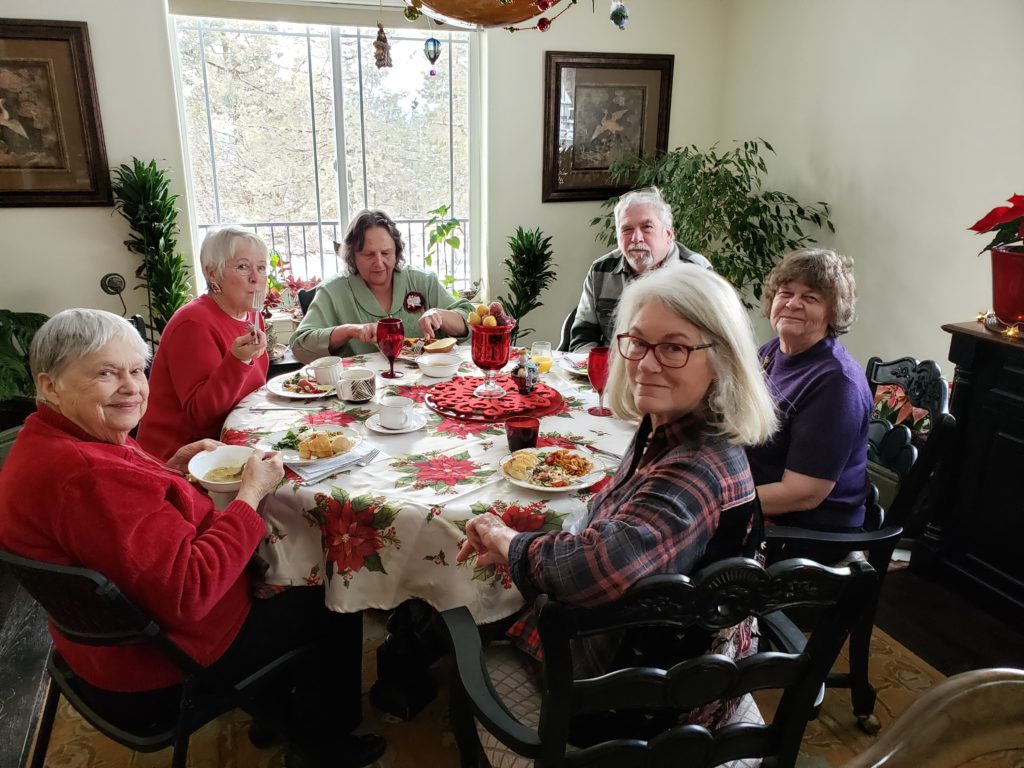
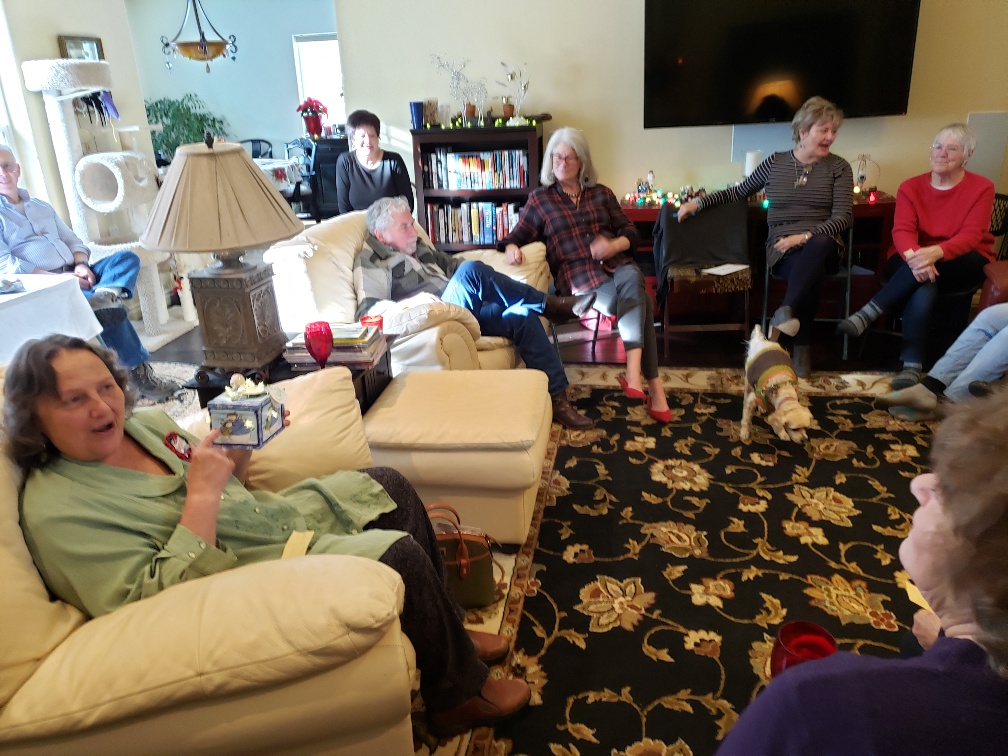
On Saturday December 14, over a dozen members and friends of LWV Klamath County gathered at the home of Diane Shockey (at right in the apron) at Running Y for a festive holiday potluck luncheon. We enjoyed snacks, main dishes and desserts, all delicious, and shared news and stories.
The weather outside may have been cold, but everyone was warm and happy indoors.
Everyone enjoyed the fun gift exchange and the LWV KC made over $200 during this fundraiser.
Diane’s home was a lovely backdrop for our gathering, and it provided a good way for members and family to reinforce our group spirit as we move forward in 2020 with many plans to celebrate the 100th anniversary of the 19th Amendment and the women’s right to vote.