People Not Politicians submit tens of thousands of petition signatures to end gerrymandering in Oregon
SALEM—Today, the People Not Politicians campaign, the broad and diverse coalition that has come together to end gerrymandering in Oregon, submitted tens of thousands of signatures to the Oregon Secretary of State for Initiative Petition 57 (“IP57”), just days after filing a lawsuit in Federal Court to ensure that all of the signatures gathered to qualify its redistricting reform initiative for the November 2020 ballot would count.
“People Not Politicians is committed to ensuring that redistricting reform happens before Oregon draws new maps in 2021. We forged ahead through unprecedented times with an unprecedented signature gathering program, bringing in tens of thousands of petitions from Oregonians in barely over one month,” said Norman Turrill, Chief Petitioner and Chair of the People Not Politicians campaign committee.
“We filed our lawsuit on Tuesday asking the Court to recognize the extreme and unprecedented circumstances of a global pandemic that impacted the signature gathering process in Oregon, and to protect our First Amendment rights by reducing the barriers to the ballot,” Turrill continued.
Initiative Petition 57, filed in November 2019, would create the Oregon Citizens Redistricting Commission and put redistricting in the hands of Oregonians, not our politicians. The commission would consist of 12 Oregonians who applied and were selected from qualified applicants – four from the first largest political party, four from the second largest political party, and four others who are third party members or non-affiliated. Major donors to political candidates or parties would not be eligible. Neither would elected-officials, political party officials or their family members. Commissioners would be selected to represent the broad diversity of Oregonians.
After succeeding through multiple politically-motivated legal challenges and delays, the campaign was approved to collect signatures in April, weeks after Oregon Governor Kate Brown issued several emergency orders and the Stay Home, Save Lives program, which, while necessary for public health, effectively ended all possibility of traditional in-person signature gathering efforts.
After weeks of brainstorming and preparation, at the end of May, the People Not Politicians campaign launched a novel, creative and aggressive no-contact signature gathering campaign to collect signatures through direct mail, e-petitions and virtual grassroots communications efforts to qualify for the November ballot.
“Our first priority, of course, has been to ensure the safety and health of all Oregonians during this time and we adhered to the social distancing measures under Governor Brown’s Executive Orders with an abundance of caution,” said Candalynn Johnson, Deputy Campaign Manager for People Not Politicians. “But—democracy doesn’t stop. Redistricting will happen in 2021, and Oregonians deserve a redistricting process that is about the people, not politicians. During this time of unrest, our need to protect and advance the democratic process and ensure all Oregonians are represented is more important than ever.”
The initiative campaign coalition came together in April of 2019 and has been led by the League of Women Voters of Oregon, Oregon Farm Bureau, Common Cause Oregon, the Independent Party of Oregon, NAACP Eugene/Springfield Branch, Taxpayer Association of Oregon, OSPIRG, Oregon’s Progressive Party, and tens of thousands of Oregonians who supported the effort to remove conflicts of interest from drawing of voter lines.
Good news! Here’s a press release from Crag Law Center that explains what happened and some of what this means. I want to add a little more context by way of giving kudos to the legal team that accomplished this.
The Crag Law Center and the LWV go way back. The LWVUS and LWVOR have filed two amicus briefs in support of plaintiffs in Juliana v. USA, the landmark climate lawsuit initiated in 2015 and is still ongoing. Crag’s Executive Director Courtney Johnson drafted both of those briefs for the Leagues. That in addition to work against JCEP.
Tonia Moro, who represented the Coos Bay Citizens for Renewables in the LUBA reversal, has been in the JCEP fight over the long haul, too. She was supported in this current work in part by a grant from the LWVOR, precisely because of her track record for getting things done and the understanding that receipt of local land use permits, including this one, are an essential part of the bigger effort to stop this project.
There’s way more to this very complex story, but we want to underscore Tonia’s and Courtney and her colleagues at Crag’s excellent work on behalf of the local, state, national, and global community, including to stop this massive project. If built, it would deal an enormous blow to Oregon’s goals and efforts to reduce GHG emissions and ensure environmental justice and cause irreparable damage to the natural and human environment across southern Oregon and in the Coos Bay Estuary and community.
As the State of Oregon is battling JCEP’s attempt to get FERC to declare that Oregon waived its Section 401 authority, making moot DEQ’s May 2019 denial of that essential permit, the EPA released its new rules on that section of the Clean Water Act yesterday. In other words, the Administration is lending a hand to get JCEP done in case FERC doesn’t do this additional job.
A congratulatory article in the Financial Times this morning said this: “The Trump administration has curbed US states’ power to veto energy infrastructure projects, drawing praise from fossil fuel industries for a move that could make it easier to build pipelines and export terminals across the country. The Environmental Protection Agency on Monday reinterpreted provisions in the federal Clean Water Act that state governors had used to stymie projects targeted by climate campaigners. . . . The state of Oregon blocked the Jordan Cove liquefied natural gas export terminal citing the provision. . . . Energy companies argued the states were abusing a clause in the water law to obstruct projects they opposed for other reasons. Andrew Wheeler, EPA administrator, said the agency was returning the certification process to its ‘original purpose, which is to review potential impacts that discharges from federally permitted projects may have on water resources, not to indefinitely delay or block critically important infrastructure.’”
It’s not clear yet whether Pembina will attempt to use the new regs to try to get JCEP to happen. It seems that JCEP might submit a new application for their 401 permit now under the new rules as a Plan B, but they also might wait and let their waiver claim to FERC play out first. If FERC grants their petition, Oregon (and community opponents of JCEP) may sue. If they reapply, the regular state permitting process will need to proceed. It’s unlikely DEQ will grant the permit because of the egregious adverse impacts, even under the new rules. And Governor Brown (and the LWVOR) commented in opposition to the proposed regs last fall (both attached), charging that they were unlawful misinterpretations of the Clean Water Act, as did any other states and environmental organizations. That route likely leads to court, as well.
dateline: May 27, 2020
NATURAL GAS: Ore. landowners sue over ‘indefensible’ export project
A group of about 30 property owners has sued to block a proposed Oregon liquefied natural gas export terminal and corresponding pipeline that would cut across their land.
The landowners asked the U.S. Court of Appeals for the District of Columbia Circuit on Friday to review the Federal Energy Regulatory Commission’s approval of the Jordan Cove LNG export project and the Pacific Connector Gas pipeline.
“We will do all we can to try and stop this incredible overreach and the blatant misuse of eminent domain to benefit special interests over public interest,” said Deb Evans, a challenger in the case.
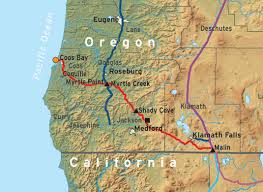
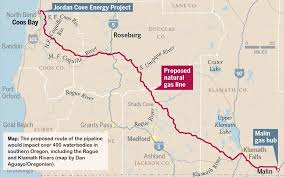
The $10 billion project, backed by the Canada-based Pembina Pipeline Corp., would include a 230-mile, 36-inch-diameter feeder pipeline that would run from a town along the Oregon-California border to a 200-acre natural gas liquefaction and export terminal at Coos Bay. The export hub would be the first on the West Coast, closer to energy-hungry Asian markets.
The oil and gas industry has been pushing for the development of LNG terminals to facilitate greater exports of gas as the fuel glut continues. The terminals liquefy gas by refrigerating it to minus 260 degrees Fahrenheit, which reduces its volume and allows it to be transported on ships. The Jordan Cove hub could liquefy up to 1.04 billion cubic feet of natural gas per day for export to Asia.
FERC approved the project in March and last week upheld its decision despite requests to reconsider from affected landowners, the state of Oregon, tribes, environmentalists and fishing interests (Greenwire, May 21).
David Bookbinder, chief counsel of the Niskanen Center, who is representing the landowners, said he’s confident the D.C. Circuit will rule in their favor.
The Jordan Cove project, he argues, does not pass the eminent domain test. While FERC can issue a certificate of public convenience and necessity, which grants eminent domain authority to developers, the project must demonstrably serve public interests.
Bookbinder said the D.C. Circuit made clear last year in City of Oberlin, Ohio, v. FERC that an export-only project doesn’t automatically meet this threshold. In that case, the court instructed FERC to take a second look at its rationale for approving the Nexus pipeline, which runs through Ohio and Michigan on its way to Canada (Energywire, Sept. 9, 2019).
“The law is you can’t count this,” he said.
Bookbinder will argue on behalf of landowners affected by the Jordan Cove project that a Canadian company selling Canadian gas likewise does not benefit the American public.
He also noted an absence of gas contracts for the project. In 2016, under the Obama administration, FERC rejected Jordan Cove because of concerns about consumer demand. Bookbinder said the project’s developers have not assuaged those fears.
“The idea that a company that has no customers will take U.S. property in order to ship Canadian gas to Japan is outrageous,” Bookbinder said. “That is indefensible in so many different ways.”
‘Landowners get thrown under the bus’
For the property owners involved, the court filing offers a glimmer of hope in what has been a 15-year saga.
The Jordan Cove project was proposed as a natural gas import facility in the early 2000s, when Evans and her husband, Ron Schaaf, bought their property. The project was changed to an export site when U.S. hydraulic fracturing operations significantly boosted domestic supplies.
“We were busy; our kids were in school. We followed it, but not super-close,” Evans said. “Then fracking came in, and the project disintegrated.”
In 2013, Jordan Cove’s developers filed a new application with FERC. Their bid was denied in 2016 following concerns about a lack of customers; falling property values; and harm to environmental resources that support timber, fishing and other local industries (Energywire, March 14, 2016).
“It’s the same landowners who have been affected by this for 15 years,” Schaaf said. “Landowners get thrown under the bus, and many landowners don’t have a lot of money. Not everyone has the opportunity to advocate for themselves.”
FERC Chairman Neil Chatterjee, a Republican, stressed that while Pembina has eminent domain authority to condemn private property for its pipeline, no construction on the pipeline or LNG terminal, including land clearing, can take place until the company has obtained the necessary permits — which is proving to be an uphill battle.
Oregon’s Department of Environmental Quality denied the project’s water quality certification. The state Department of Land Conservation and Development rejected a permit because of the adverse effects the facility would have on coastal and critical habitats, as well as on endangered species. In February, it ruled that the project was not in line with the state’s coastal zone land use laws.
Pembina recently withdrew its application for a dredging permit when the Department of State Lands indicated that it was about to reject that application, as well.
Evans said she doesn’t understand why FERC would allow the pipeline developer to condemn her land while at the same time agreeing that no construction can begin without the requisite permits.
“Why would eminent domain be allowed before the conditions are met?” she asked.
‘FERC is delivering on its promise’
On a call with reporters after rejecting requests for rehearing on the project, Chatterjee said eminent domain is outside FERC’s jurisdiction.
“When it comes to eminent domain, we have no authority,” he said. “We’ve got expertise in how essential it is to siting pipelines.”
For landowners, Friday’s D.C. Circuit petition carries extra meaning. FERC’s swift rejection of the request for rehearing allowed landowners to seek recourse instead of hanging in legal limbo while pipeline construction moved forward.
“It’s a good example of Neil Chatterjee following up and delivering on his promises,” Bookbinder said. “FERC is delivering on its promise that it would not stop landowners from going to court.”
The commission has recently come under fire for issuing so-called tolling orders, which indefinitely extend the deadline for FERC to respond to landowner challenges while allowing pipeline construction to proceed.
FERC has issued a tolling order for every rehearing request filed over the past 12 years. Every case was then eventually denied. On average, 212 days — about seven months — passed between the time a landowner made a request for rehearing and when FERC ultimately denied it.
While Chatterjee has said his agency has addressed the issue, a case against FERC’s use of tolling orders is pending before the D.C. Circuit (Energywire, April 28).
Schaaf said he’s grateful that the landowners’ complaint over Jordan Cove can move forward.
“We understand owning property is a privilege and fighting for it is a privilege,” he said. “We’ll be in this until the end. We don’t know how it’s going to turn out.”
1) Recall from last update that the State of Oregon (specifically four agencies) had filed a petition for Rehearing on FERC’s Order granting the two major federal authorizations JCEP needs to go forward. The article also mentioned that a coalition of around 30 organizations also filed a petition for Rehearing, but was not very specific. That petition included Niskanen Center, the law firm representing around 20 affected landowners, Sierra Club, and also for the interest of this group, the four local LWV that have been jointly opposing JCEP since their application. Yesterday, the FERC met and denied those petitions. I haven’t read the Order yet, but it includes some confusing language that we’ll probably need legal eyes to interpret. Hopefully, it doesn’t throw any problems in the direction of key petitioners. The Niskanen Center has already filed an appeal to the DC Circuit and the coalition’s attorney members are moving in that direction, as well.
2) JCEP has filed a Declaratory Order (roughly a petition), charging that the State of Oregon failed to action on the company’s Section 401 Water Quality Certification application within the one-year time limit specified in the Clean Water Act and thereby waived its authority to determine whether the Project would violate Oregon’s Water Quality Standards. The Department of Environmental Quality denied JCEP’s application in May 2019. A Section 401 permit is necessary for the Project to go forward, but the waiver would make the denial null. The State is working on a response. The deadline is June 4.
3) JCEP has appealed the Oregon Department of Land Conservation and Development (DLCD) Objection to the company’s Coastal Zone Management Act certification to the Secretary of Commerce, asking him to override the State’s decision. This is an allowable option in the event of an objection, but we have looked carefully at the rules governing under what circumstances the Secretary can legally perform an override and agree with the State and many others that the required circumstances don’t exist. The Oregon AG’s Office submitted the required Brief last Tuesday and we are now awaiting the next step. If an override occurs, this issue could wind up in court as well.
4) An outside, apparently well-funded national group (Consumer Energy Alliance) has created an “astroturf” (faux-grassroots) entity called the Western States and Tribal Natural Gas Initiative (WSTM) involving natural gas and LNG export proponents (e.g., western states’ local government officials, Chambers of Commerce, and some tribal groups) in the push for the JCEP. Expect to see a full-page ad in the Oregonian this Sunday, purporting to be a local and grassroots effort linking the construction of JCEP with means for economic recovery from COVID-19. News (start at 2:02:48 on the video) of this and other activities by CEA came via connections in Utah with concerns about fossil fuel development in the fracking fields there. More as this develops. As if Goliath wasn’t muscular enough already.
5) Finally, on the human side of this, here is a link to coverage of how this (the JCEP) pipeline project is affecting property owners whose land happens to lie on the proposed pipeline route. There’s a lot here. The blogs are excellent.
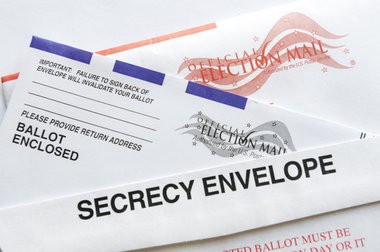
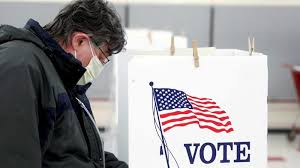
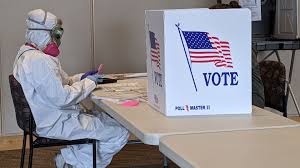
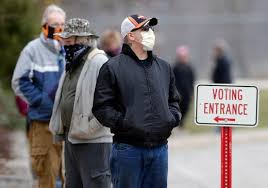
Election security and the ability to vote by mail or remotely instead of at a polling place has become a major question for the 2020 general election.Of course Oregon has had mail-in only ballots since 1998. Now other states will look at Oregon’s system to learn some best practices.
Oregon’s Vote-by-Mail is secure and accurate. It protects voter privacy. Plus, it has many security features to prevent fraud and election interference.
This video is about Election Security with the Vote-by-Mail process in Oregon. It shows the many safeguards that are used to ensure that all votes are counted accurately, that the election process is secure from interference and fraud, and that the privacy of all voters is protected. Elections Director Tim Scott explains how Oregon’s vote-by-mail process works with slides and videos. He also answers audience questions about the incidence of fraud, voter suppression and the security of vote-counting in other states.
We have 20 days as of June 10, 2020 to get fair maps on the ballot in November, and we need all hands on deck! In a matter of minutes, your help can move us closer to reaching our goal.
Sign IP 57 and join us in the fight for a fair and transparent redistricting process in Oregon! The petition calls for an independent citizen-led redistricting commission that will ensure Oregonians choose their representatives and not the other way around.
We believe Oregon voters should choose their politicians—politicians should not choose their voters. Have you signed IP 57?
In this time of uncertainty, there is one thing we can all agree on; every Oregonian deserves to be represented and every eligible voter’s vote should count. That’s why we joined People Not Politicians, and together we have launched a statewide signature gathering campaign for IP 57 to put redistricting reform on the ballot this November and give everyday Oregonians the opportunity to make our voices heard.
What does IP 57 call for? Anindependent, citizen-led redistricting commission.
The balanced commission would be made up of 12 citizens with 4 from each of the two largest political parties and 4 who are not affiliated with the largest parties.
Incumbent politicians, lobbyists, and political operatives are BANNED from the commission.
Commissioners may not favor or discriminate against any candidate, elected official or political party.
Democracy doesn’t stop and neither do we.
The League of Women Voters of Oregon and People Not Politicians need your help. Your signature today makes all the difference in making sure Oregonians can vote for a fair, transparent, and independent redistricting citizen’s commission this November.
It’s simple. Just visit the People Not Politicians website and take a few steps. First, read Initiative Petition 57. Next, enter your information to get your petition. Then, print, hand-sign and mail in your signature sheet.
Other organizations that support the People Not Politicians petition:
Democracy as an ideal and process has always been at the heart of the mission of the LWV. From its incepetion as a way to gain women’s suffrage, the organization has focused on voting rights, and by extension, elections, and thus the whole basis of representative democracy.
In the Spring of 2020, the avenues of democracy have been severely challenged by a global pandemic which has restricted the movement of millions of people. The restrictions have affected every part of the process, from voting and elections, to the US census, on which future representation is counted for Congress. In preparation for a national election in the US and other countries, including South Korea, Israel, and the UK, government leaders have been forced to consider how to invite participation during a near-total social shut-down.
Here are some thoughtful articles on some of these issues in the U.S. The LWV is closely monitoring how the US will promote the workings of our democratic institutions.
While Census forms continue to be collected and counted, the Bureau has postponed or suspended operations around in-person survey collection in hard-to-count communities. Depending on guidance from the CDC, they may also delay the deployment of enumerators hired to go door-to-door and collect outstanding survey data from houses that have not completed the survey online, via phone, or by mail. There are still ways for these communities to participate in the census—online, by mail, or by phone—and the League continues to monitor how the census plans to ensure hard to count communities still get included.
The Census Bureau is being incredibly transparent about the decisions they are making around their operational plan. They continue to hold stakeholder calls, brief officials, and issue guidance to partner organizations who are helping to get out the count! The census timeline is mandated by federal law and the U.S. Constitution. The Census Bureau is doing everything in their power to help those living in the United States, fill out their questionnaires in the appropriate time frame.
Completing the census is about collecting the necessary information to determine funding for our community needs. Census data is used to distribute billions of dollars in funding that goes to ensure that public safety, health facilities, businesses, and communities have the resources they need to take care of their communities. The League is a partner of the Census Counts Campaign which has issued digital guidance on how to turn in-person events into digital ones for those participating in Get Out the Count activities! We have also built out a robust census action kit for individuals and Leagues to use when helping get out the count.
The most important thing we can do right now is to submit the questionnaire via one of the three ways we’ve already discussed. The second most important thing we can do is to ask our friends, families, and yell across the street to our neighbors—“Have you taken the Census, yet?”
The CDC recommendation for social distancing to contain the coronavirus comes at a time when many Americans are preparing to cast their ballots in upcoming primary elections. While voters’ health and that of their communities is paramount, the League of Women Voters still encourages voters to exercise their right to vote! There are many ways for voters to participate in elections while mitigating their risk of exposure.
Early and Absentee Voting
Some version of early voting and absentee voting, or vote-by-mail, is available in every state. For people in high-risk categories of the virus, the League of Women Voters encourages these voters to limit their exposure to crowds on Election Day. Even voters who are not high risk and want to do their part to curb the virus should consider these options. The more voters who cast their ballots early, the fewer long lines and crowds we will see on Election Day.
Local Board of Elections
If voters have missed their absentee ballot deadlines, they still may be able to vote without going to a busy polling place. Many local boards of election offices can support voters in casting a ballot in person and avoid busy polling places. Voters can find their local board of elections information on the League’s election website VOTE411.org and reach out to learn if this is an option where they live.
Non-Peak Hours
We are all familiar with crowds and long lines on Election Day, especially first thing in the morning, over lunch hours, and after work. Voters can limit their interaction with the public by planning to vote during non-peak hours, like the middle of the morning and afternoon.
VOTE411.org
The League’s nonpartisan election website VOTE411.org has everything voters need to find out their options for participating in early and absentee voting. VOTE411 will also have special alerts on primary election days highlighting any changes to normal voting procedures, including any last-minute changes to polling locations. The site is a personalized voting information hub where voters can check their registration, find their polling place, see what will be on your ballot, and more.
Elections and Debates, Coronavirus and Civil Rights: from the LWV-OR
Vote by mail in Oregon
Public health declarations are already affecting our elections. Vote by mail will become more important and our public candidate events are already being revised or cancelled. We are looking at the challenge of collecting initiative signatures.
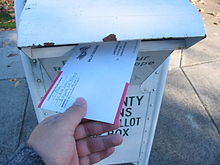
Vote by Mail Senator Wyden is proposing to mandate national emergency vote-by-mail. The need for it is clear as two states, Louisiana and now Georgia, have delayed their presidential primaries. Oregon has vote-by-mail, with ballot return envelope postage now pre-paid. The League still strongly recommends using the ballot dropboxes instead, as many already do, to keep costs down.
Debates and Events LWVOR Voter Service is adapting by trying to change to virtual debates with distance audiences, looking for ways to give audiences the opportunity to ask questions and listen to candidates remotely. This is challenging as public meeting size limits are getting smaller. The studios we are working with are concerned about how they will sanitize their equipment and some candidates are already cancelling for these much smaller events.
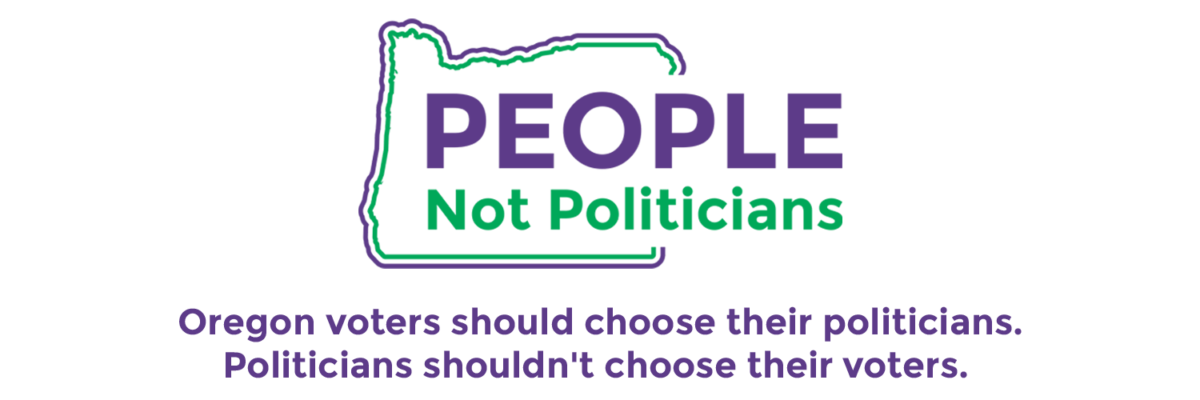
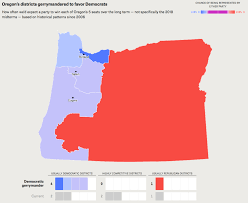
We the people – not politicians – should draw voting maps
The League of Women Voters of Oregon believes in putting our best democracy foot forward. We know that we deserve the best possible government and we invest the energy to achieve it. Oregon led the fight for direct election of Senators to Congress, pioneered vote-by-mail and has one of the nation’s most engaged citizenry. Now we are reforming Oregon’s redistricting process.
The League has joined the People Not Politicians campaign, a diverse coalition made up of all party affiliations, income levels, backgrounds, identities, and all corners of Oregon, to rally for equal, fair and transparent representation at the state and congressional level.
Oregon voters should be choosing their representatives- representatives should not get to choose their voters.
The League supports redistricting reform that would make our system less susceptible to abuse and unrepresentative distortions. With an independent redistricting commission, we would take the process of redistricting out of the hands of partisan politicians and back into the hands of voters. To defend the principles of good government against potential gerrymandering, our proposal combines a multi-partisan independent commission with strong criteria and substantial public input. As we approach the 2020 census and the potential of adding a sixth congressional district to Oregon, we need to make sure district boundaries are fair. Biased political goals can manipulate this process and affect election outcomes at state and national levels.
Norman Turrill and Kate Titus Turrill is president of League of Women Voters of Oregon Advocacy Fund Governance Coordinator and past president of League of Women Voters. He chairs the People Not Politicians campaign committee. Titus is the executive director of Common Cause Oregon, a nonpartisan government watchdog organization.
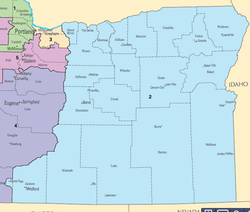
This simple concept is the basis of our electoral system. It is embedded in the U.S. Constitution’s opening three words, “We the People.” And it is the principle behind a series of ballot initiatives that could reshape Oregon’s political future. Under current Oregon law, state legislators redraw the boundaries of congressional and state legislative districts after each census to adjust for population changes. This once-in-a-decade system was designed to ensure that each district contains roughly the same number of people. In the 2020 census, Oregon is projected to gain another U.S. congressional seat due to population growth, which means not only will we have a new district and a new electoral vote, but all five of our existing congressional district boundaries will radically change in shape and size. Not only are congressional districts redrawn, but so are the 90 state representative and state senate seats that make up Oregon’s Legislature. Every single Oregonian will be impacted – every single Oregonian should be represented. These significant changes make the need for a fairer process more important than ever.
Letting politicians draw their own voting maps is an inherent conflict of interest, like putting the fox in charge of the henhouse. Politicians in power shouldn’t be allowed to draw voting maps that benefit themselves, but that’s exactly what the process allows for now. We need to reform the process to create a fair system so that Oregon voters are choosing their politicians, instead of politicians choosing their voters.
A diverse coalition, People Not Politicians, has united across party, identity and geographic lines to propose a fair and transparent redistricting system that puts everyday Oregonians in charge of drawing these districts. We are asking voters to support a series of measures proposed for the November ballot that would create an independent citizen redistricting commission to draw Oregon’s voting maps in 2021 and beyond.
The independent citizen redistricting commission would be made up of ordinary Oregonians — four members of the state’s largest party, four of the second largest party, and four registered voters unaffiliated with either major party. No lobbyists or consultants, big dollar political donors, party officers or elected officials would be allowed to serve.
The commission would draw district borders with respect to geographic and voter diversity, reflecting city, county or other natural boundaries, as well as language, racial or other communities of interest. Favoritism or discrimination against any political party or office holder is prohibited. Perhaps most importantly, the entire process would be completed with full transparency and public meetings held across the state, instead of behind closed doors in the Capitol. This reform would put Oregon at the forefront of history. We are the latest voice in the chorus of activists across the United States calling for people, not politicians, to be the center of the redistricting process.
Oregon is known for its ballot initiative process which gives ordinary voters the ultimate say in the biggest issues facing our state. Likewise, our coalition of unexpected allies – which includes nonpartisan groups Common Cause and League of Women Voters, the Independent Party of Oregon, NAACP, the Taxpayer Association of Oregon and the Oregon Farm Bureau – wants to put people, not politicians, in charge of drawing our maps.
To be clear, this reform isn’t about taking power from one party and giving it to the other. The goal is to give Oregonians the opportunity for a fair, transparent process by which voting lines are drawn which will allow for more competitive primaries and general elections, for historically marginalized communities to be represented, and for elected officials to be held accountable to their voters. It’s about unrigging the electoral system and holding our officials accountable to the growing number of people who call Oregon home.
Oregonians face a choice – to let politicians draw districts in a way that serve their own interests, or to reform Oregon’s redistricting process with a fair and transparent process to draw districts that represent all Oregonians. After all, the Constitution does not begin with the words “We the Politicians.” In fair elections, voters pick their leaders, not the other way around.
Oregon is one of only five states which votes entirely by mail. Many people are already concerned with this issue during the 2020 general election cycle. This is because the current public health situation may prevent voting in person under some circumstances. Oregon has led the nation in the move to complete vote by mail for all elections. Let’s look at this in more detail.
We are all equal at the ballot box, but only if we vote. We engage millions of voters every year. Thus we ensure Americans have the information they need to participate in elections that determine our future.
Why it matters and what we are doing: LWV
Elections impact every aspect of our lives, and we all need to weigh in. Every year we host thousands of community events to mobilize and help voters participate. LWV also hosts hundreds of debates and forums nationwide for voters to hear directly from the candidates.
The idea of national vote-by-mail:
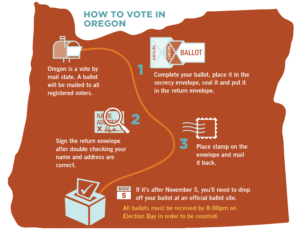
According to the National Conference of state Legislatures, five states currently conduct all elections entirely by mail: Colorado, Hawaii, Oregon, Washington and Utah. At least 21 other states have laws that allow certain smaller elections, such as school board contests, to be conducted by mail. For these elections, all registered voters receive a ballot in the mail. The voter marks the ballot, puts it in a secrecy envelope or sleeve and then into a separate mailing envelope, signs an affidavit on the exterior of the mailing envelope, and returns the package via mail or by dropping it off.
Ballots are mailed out well ahead of Election Day, and thus voters have an “election period,” not just a single day, to vote. All-mail elections can be thought of as absentee voting for everyone. This system is also referred to as “vote by mail.”
While “all-mail elections” means that every registered voter receives a ballot by mail, this does not preclude in-person voting opportunities on and/or before Election Day. For example, despite the fact that all registered voters in Colorado are mailed a ballot, voters can choose to cast a ballot at an in-person vote center during the early voting period or on Election Day (or drop off, or mail, their ballot back).
Generally, states begin with providing all-mail elections only in certain circumstances, and then add additional opportunities as citizens become familiar with procedures. Oregon’s vote-by-mail timeline includes four times that the legislature acted prior to the 1998 citizens’ vote that made Oregon the first all-mail election state.
LWV Oregon: Our views on how vote by mail works here
Request a mail-in ballot
Oregon is VBM (vote by mail) so all ballots are mail-in. To replace a ballot, see (ballot help): If your ballot arrives damaged, you make a mistake, spill something, lose your ballot, or for any other reason, contact your county elections office for a replacement ballot.
Observing the counting process
Oregon supports unparalleled transparency. Contact your county elections office to observe the election process.
Deadlines for receiving and postmarks for ballots?
In Oregon, by 8pm on election day: received in the mail, into dropboxes/drop sites, or delivered to the County Elections offices. Late arriving ballots are not counted. Campaigns and political parties call daily, using daily ballot return reports from elections, to get ballots in.
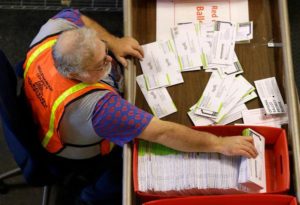
Counting Timelines
When do they start counting and when must counting be completed?
Ballot counting in Lane County, Oregon usually starts the Friday before election day. NO results are ever released before polling closes. Counting continues until completed on election day. That is not the same as election certification, determined by statute. For our May 19, 2020 primary, the election must be certified by June 18th. See our 2020 election calendar for state statute references.
Prepare to count-
How many people are needed, how are these people trained?
Experienced staff usually just needs a review, otherwise a day, half-day to train.
What are the top 5 reasons people’s ballots are rejected?
Per our state Elections Director, 2 big reasons- ballot isn’t signed or signature doesn’t match.
How are voters notified if there is a “problem” with their ballot and what processes are in place to allow voters to remedy the “problem”?
If voters share contact info, county elections will call or email. However, this is now problematic since this is public information and voters don’t want the spam. The state could track with ballot tracker, but it needs to verify if it can notify voters for problems.
What are the key considerations when operating a vote by mail infrastructure to ensure all votes are counted?
Voter Registration: publicize widely and remind often because if voters aren’t registered, they can’t vote. Our #MotorVoter through the DMV is not perfect. We haven’t yet addressed party registration online, currently a separate, easily overlooked postcard.
Ballot Mailing Alerts: tell voters when ballots are being mailed, to contact their county elections’ offices if they haven’t gotten theirs.
Track Your Ballot Encourage voters to sign up for ballot tracker, or whatever program may exist in their area, to track their ballots, from mailed, to received, to counted.
Deadline pushing– Ballots must be received by deadlines, in Oregon by 8pm on election day-postmarks don’t help, and now, with pre-paid envelopes, our state Elections Director cautions that there will not be postmarks anyway.
Secure Procedures There are manuals for thorough safety protocols to control location oversight, tracking, redundant staff review, always having political party inclusion in each team with everyone stopping together for meal or rest room breaks, etc.
Who are key allies for this issue? Do they include groups representing communities of color, the disability community, etc.?
ACLU, political parties, even though they do not work directly with LWV.
What research or data can you share to show that vote by mail has actually increased turnout, especially among underrepresented groups?
See The SoS Election Statistics page for general, primary, special election turnout and ballot return history since 2000. OR VBM statistics, a comprehensive history, up to 2006.
LWV oregon public education messaging on how to vote by mail
Is there any type of messages or methods that seemed effective when explaining to the general public on how to vote-by-mail?
Oregon started VBM in the early 1980s, gradually, for local special elections.
How did you measure its effectiveness?
During the implementation of all-mail elections in oregon, what were some of the challenges advocates for all-mail elections had to overcome?
Vote by mail, automatic voter registration, pre-paid ballot postage, pre-registration for younger voters, all have been opposed, sometimes invoking vulnerability to voter fraud. No one has been able to validate those concerns. From NPR, 2018, “If and when a bank gets robbed or a car gets stolen, we don’t stop using banks or cars. We enforce the laws we have in place.”
LWV Oregon Position: How should advocates for all-mail elections prepare for these challenges during the 2020 General Election?
Encourage elections offices to prepare ASAP:
Establish needs (quantity, cost, time, and materials’ availability), for paper, printing, processing and staffing/labor needs.
Equipment needs to be in place and compatible, with staff trained to use it.
We are concerned that our veteran pollworking crew, many older and notably vulnerable to COVID-19, may not be available.
Coordinate a publicity campaign with trustworthy branding, multi-faceted outreach to various communities and media, especially social media.
Include partners like the Dept of ED, youth groups, League, ACLU, disability and minority voters rights’ groups, Chambers of Commerce, City Clubs, etc.
Here is a recap of current legislative affairs in the state of Oregon from the LWV Oregon:
CLIMATE CHANGE
Carbon Cap and Invest: The 2020 session ended three days early due to an impasse over the Republican walk-out. Republican legislators refused to return to work in Salem unless work was restricted to their preferred bills. Jordan Cove Energy Project (JCEP): The highest profile issue at this time continues to be how the members of the Federal Energy Regulatory Commission (FERC) will vote on the two major federal authorizations JCEP needs to move forward with their proposed project. Our Children’s Trust: LWVUS jointly with LWVOR is submitting on March 12 a new amicus brief to support Our Children’s Trust’s (OCT) planned appeal to the full 9th Circuit Court. Climate Emergency: The city of Portland has a published Draft of their ClimateEmergency Declaration. The deadline for input to Portland’s declaration is March 16. Four or five other Oregon jurisdictions have declared a climate crisis.
Education Committee and Bills: In an abbreviated session, with an abrupt end, leaving without finishing the people’s business…only one minor education bill passed both chambers.
Campaign Finance: As we track the status of bills that were of interest to League positions, we observe that this is really a list of bills that did not pass because of the walkout of Republican legislators, no matter how important. Public Records: Bill would make the Public Records Advocate independent. Redistricting: Redistricting initiatives certified ballot titles appealed to Oregon Supreme Court. Immigration: The League provided testimony on February 5 for HB 4121. This bill did not move from its policy committee, so it died in committee. Resilience and Open Government: The ShakeAlerts system that we have covered had funding approved in the Way & Means Committee. However, it was still in consideration with many other bills lacking final chamber deliberations. No other resilience bills were funded and all are moot at this point. Access: A look at the Oregon legislature and the 40/40 session.
Budgets: Many policy bills had budget requests. None passed due to the walkout. The five final budget bills also did not pass. League members will begin meeting with others in preparation for the 2021-23 biennium while hoping an agreement can be reached to consider those policy bills as well as the budget bills during a special session. Air Quality: HB 4024, 4066, 4068, and SB 5702 did not pass, but the Dept. of Environmental Quality (DEQ) works year-round on behalf of Oregonians and League volunteers follow that work. With the Governor’s Executive Order 20-04, we will need volunteers to follow every agency. Forestry: The session essentially closed March 5th due to the Republican walkout with only three minor bills passed. None of the dozen wildfire and forestry bills were among them. League attended forestry meetings, including information on the Western Oregon State Forest Management Plan. Coastal Issues: Meetings abound as work continues on coastal issues. The public is welcome to attend. Energy: The Governor’s Executive Order 20-04 includes directions to the Public Utility Commission to work with utilities to move toward GHG reduction goals while considering the impact to vulnerable communities. They also need to evaluate the electric companies’ risk-based wildfire protection plans. The Dept. of Energy is to address energy efficiency standards. The Northwest Energy Coalition recognizes the League. Land Use: League continues to be engaged in rulemaking on “middle housing”. The Dept. of Consumer and Business Services (DCBS) Building Codes Division (BCD) and the Dept. of Land Conservation and Development (DLCD) will be engaged in the Governor’s Executive Order 20-04. Water: A segment of the Nehalem River is now officially a State Scenic Waterway. Drought has been declared for Klamath County as precipitation has been below-normal across the state. Work on a 100-year Water Vision for Oregon will continue. Toxics/Pesticides: Although HB 4109, banning chlorpyrifos, a neurotoxic pesticide, was another bill left on the table by the walkout, the Oregon Dept. of Agriculture will continue its Work Group with a meeting scheduled March 30. Transportation: Comment on the STIP! Also, the Governor’s Executive Order 20-04 is directed to conduct a statewide transportation electrification infrastructure needs analysis and evaluate GHG emissions related to transportation projects.
Human Services: Capital Construction and Full Ways and Means heard final bills requesting Funds, but many bills were waiting for Senate or House floor votes. Healthcare: The walkout doomed the two dozen health care bills we were monitoring. SB 1535 B passed the House Rules Committee with a 4 yes to 3 absent vote. Housing: The Legislative session ended with a number of lost opportunities intended to address Oregon’s housing crisis.
As an official “Intervenor” in the on-going legal fights over the construction of the Pembina LNG pipeline, also known as the “Jordan Cove” pipeline, the LWV Klamath County regularly participates in various legal actions. These include filings at the federal and state level, testimony, letters, protests, and support of various parties fighting the pipeline.
Would you like to see what it looks like to build a natural gas pipeline? Have a look.
LWV Activities in 2019:
LWVOR: Jordan Cove Energy Project (JCEP)
Excerpted from recent LWVOR newsletter article. ‘Four Local Leagues of Women Voters from Coos Bay to Malin and LWVOR Call for State and Federal Agencies to Deny Permits to Jordan Cove Energy Project’, Shirley Weathers, LWVRV Climate Change Coordinator and Christine Moffitt, LWVCC Board.
“…the proposed Jordan Cove Energy Project
(JCEP)…. consisting of a 530-acre liquefied natural gas storage and
export facility known as the Jordan Cove LNG project on Coos Bay and a
230-mile 36” Pacific Connector Gas Pipeline…. Proponents see jobs
(mostly temporary) and tax revenues as benefits…. Pembina spares no
expense on high-dollar promotional efforts. Opponents, including the
four local Leagues—Coos and Klamath Counties and Rogue and Umpqua
Valley—and the LWVOR, see unacceptable negative impacts on the natural
environment from air to water to aquatic and wildlife, as well as
serious safety risks…. This joint action by the four local Leagues,
taken in solidarity with other community members and organizations and
Tribes, is a step in the long journey to stop this harmful project.…”
Jordan Cove Energy Project (JCEP) (by Shirley Weathers, LWV Rogue Valley)
As a refresher, while a significant number of key specifics about the JCEP project suggest FERC could issue Denials for the pipeline and terminal as in 2016, most observers expect approvals conditioned on receipt of certain other federal and state authorizations (please see the last issue for a summary). Such an Approval Order could include a number of other issues, making it impossible to predict all of the results and next steps. We expect a flurry of filings of Requests for Rehearing—from landowners who will then be subject to eminent domain proceedings for 90-foot easements across their properties, but also from hundreds of other individual and organizational “intervenors” on the two dockets. For example, the 4 local Leagues (Coos, Klamath, Umpqua Valley and Rogue Valley) that have been jointly opposing the project since 2017 are ready to start drafting.
some Further Explanation
It is also important to note that the State of Oregon is standing firmly against one very real possibility the FERC order may bring: one or more attempts to override state authority. Congress gave states and certain Tribes authority to protect their air, water, and coastal regions. The state permits designed to allow them to do that require input on other important matters, as well. Governor Brown has consistently maintained that all involved state agencies will exercise their permitting authority diligently and in accordance with the law. We have seen throughout this process that they have done so, despite intense pressure from project proponents and mountains of work. The Governor declared in no uncertain terms last week that Oregon will consider all available options to resist unlawful federal attempts to preempt state authority.
Highlights of Recent Activities:
Here is the latest letter that LWV Klamath along with three other local leagues sent to Governor Brown.
Because the proposed Jordan Cove LNG and Pacific Connector Gas Pipeline project would directly affect the areas of the state covered by the League of Women Voters of Coos County, LWV of Umpqua Valley, LWV of Rogue Valley, and LWV of Klamath County, our Leagues oppose this project. As Intervenors in the Federal Energy Regulatory Commission the process and discussion in this letter states some of our concerns regarding information provided to FERC by Jordon Cove Energy Project’s attorney following Oregon Department of Land Conservation and Development’s objection to JCEP’s Costal Zone Management Act (CMZM) consistency certification and FERC’s February 20, 2020 decision delay.
Here is a recent article that explains in clear language some of the issues surrounding the Jordan Cover pipeline.
The League of Women Voters supports the Environment
As citizens of the world we must protect our planet from the physical, economic and public health effects of climate change while also providing pathways to economic prosperity.
Why it matters
The preservation of the physical, chemical and biological integrity
of the earth’s ecosystem is essential for maximum protection of public
health and the environment. The interrelationships of air, water and
land resources should be recognized in designing environmental
safeguards. The federal government should have the major role in setting
standards for environmental protection and pollution control.
What we’re doing
Since the 1960s, we have been at the forefront of efforts to protect air, land and water resources. Our approach to environmental protection and pollution control is one of problem solving. The League’s environmental goals aim to prevent ecological degradation, and to reduce and control pollutants before they go down the sewer, up the chimney or into the landfill. We support vigorous enforcement mechanisms, including sanctions for states and localities that do not comply with federal standards as well as substantial fines for noncompliance.
Press Release January 17, 2020: Our Children’s Trust
Decision of Divided Ninth Circuit Court of Appeals Finds Primarily for Juliana Plaintiffs, but Holds Federal Judiciary Can Do Nothing to Stop the U.S. Government in Causing Climate Change and Harming Children
The Juliana 21 Continue to Fight for Justice in the Biggest Climate Lawsuit in America
Eugene, Oregon – Today, a divided panel of the Ninth Circuit Court of Appeals “reluctantly” concluded that the youth plaintiffs’ case in Juliana v. United States must be made to the Congress, the President, or to the electorate at large. The decision finds federal courts cannot provide the youth with a remedy for their climate change injuries. In her dissent, District Judge Josephine L. Staton wrote that the youth plaintiffs brought suit to enforce the most basic structural principal embedded in our system of liberty: the Constitution does not condone the Nation’s willful destruction.
Judge Staton would hold that the youth plaintiffs have standing to challenge the government’s conduct, have articulated claims under the Constitution, and have presented sufficient evidence to press those claims at trial. Counsel for the youth plaintiffs vowed to ask the full Ninth Circuit to review the determination that federal courts can do nothing to address an admitted constitutional violation.
Julia Olson , executive director and chief legal counsel of Our Children’s Trust and co-counsel for the youth plaintiffs, commented: “The Juliana case is far from over. The Youth Plaintiffs will be asking the full court of the Ninth Circuit to review this decision and its catastrophic implications for our constitutional democracy. The Court recognized that climate change is exponentially increasing and that the federal government has long known that its actions substantially contribute to the climate crisis. Yet two of the judges on the Panel refused to set the standard for redressing the constitutional violation, to protect our Nation’s children. The standard is a question of science that should be determined at trial. The majority opinion ignores the fact that we have yet to go to trial on the issue of redressability.”
There were numerous points in which the majority opinion of Ninth Circuit Judge Andrew Hurwitz found in favor of the youth plaintiffs, including: the evidence showed climate change was occurring at an increasingly rapid pace; copious expert evidence established that the unprecedented rise in atmospheric carbon dioxide levels stemmed from fossil fuel combustion and will wreak havoc on the Earth’s climate if unchecked; the record conclusively established that the federal government has long understood the risks of fossil fuel use and increasing carbon dioxide emissions; and the record established that the government’s contribution to climate change was not simply a result of inaction.
The opinion also recognized that the youth plaintiffs had suffered concrete and particularized injuries from climate change. The panel held the district court properly found the youth plaintiffs met the Article III causation requirement because there was at least a genuine factual dispute as to whether a host of federal policies were a “substantial factor” in causing the plaintiffs’ injuries.
Yet, two of the three judges held the youth plaintiffs’ claimed injuries were not redressable by an Article III court. Specifically, the majority held it was beyond the power of federal courts to order, design, supervise, or implement the youth plaintiffs’ requested remedial plan where any effective plan would necessarily require a host of complex policy decisions entrusted to the executive and legislative branches. In short, the majority ruled the remedies the youth plaintiffs have requested must be implemented by Congress or the President, not the courts.
Philip Gregory , with Gregory Law Group of Redwood City, California and co-counsel for the youth plaintiffs, stated: “Despite finding the government was actively contributing to climate change, and despite the fact the court found these youth plaintiffs submitted evidence of concrete and particularized injuries, and despite the fact that the youth plaintiffs presented sufficient evidence to show federal policies were a substantial factor in causing plaintiffs’ constitutional injuries, a majority of the panel concluded there was nothing federal courts could do to address these constitutional violations.
We strongly disagree with this conclusion and will take this determination to the full Ninth Circuit.” Kelsey Juliana , the 23-year-old named plaintiff in Juliana and resident of Eugene, Oregon, said: “ THIS ISN’T OVER. Prepare for a petition for review en banc to the 9th circuit as we refuse to do anything but move forward and ultimately win. Courts do have an obligation to address issues of constitutional, existential crisis, like climate change.
Levi Draheim , 12-year-old plaintiff from Satellite Beach, Florida, commented: “We will continue this case because only the courts can help us. We brought this lawsuit to secure our liberties and protect our lives and our homes. Much like the civil rights cases, we firmly believe the courts can vindicate our constitutional rights and we will not stop until we get a decision that says so.”
Juliana v. United States is not about the government’s failure to act on climate. Instead, these young plaintiffs between the ages of 12 and 23, assert that the U.S. government, through its affirmative actions in creating a national energy system that causes climate change, is depriving them of their constitutional rights to life, liberty, and property, and has failed to protect essential public trust resources. The case is one of many related legal actions brought by youth in several states and countries, all supported by Our Children’s Trust, and all seeking science-based action by governments to stabilize the climate system.

 Ballots are mailed out well ahead of Election Day, and thus voters have an “election period,” not just a single day, to vote. All-mail elections can be thought of as absentee voting for everyone. This system is also referred to as “vote by mail.”